Fig. 12.
Download original image
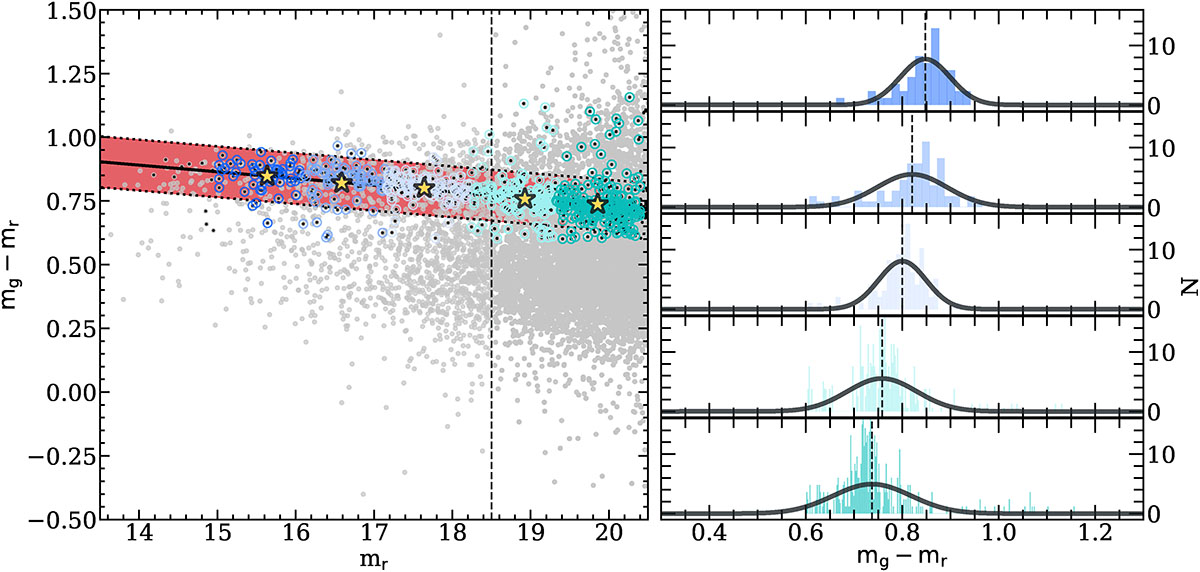
Red sequence fit from the CMD for Abell 85. The left panel shows the CMD, the grey points correspond to the galaxy cluster candidate members selected by our photometric method, the open coloured symbols show the colour-range bins used to fit the red sequence, yellow stars correspond to the mean mg − mr colour in each bin obtained from a gaussian fit, while the best fit is shown with a black solid line including the ±1σ region in red and delimeted by dotted lines. The dashed line indicates the bright-faint boundary at mr = 18.5. The right panel shows the mg − mr bins distributions, overlaid in black lines show the best guassian fit for each distribution while the dashed lines indicated the mean average mg − mr colour.
Current usage metrics show cumulative count of Article Views (full-text article views including HTML views, PDF and ePub downloads, according to the available data) and Abstracts Views on Vision4Press platform.
Data correspond to usage on the plateform after 2015. The current usage metrics is available 48-96 hours after online publication and is updated daily on week days.
Initial download of the metrics may take a while.