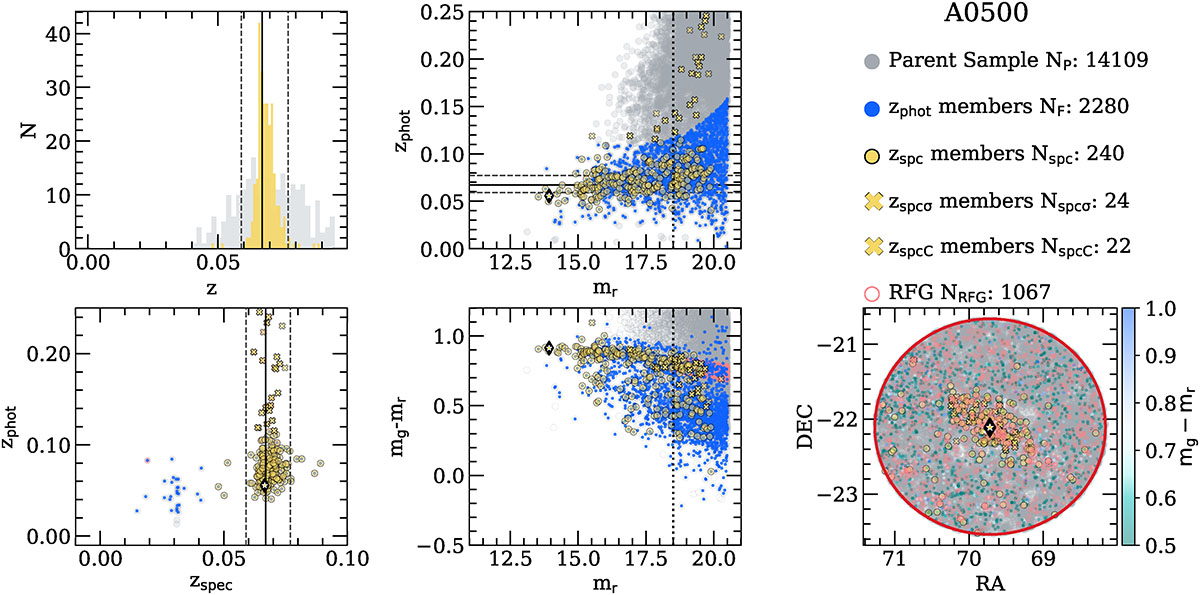
Fig. 13.
Download original image
Photometric target selection of Abell 500, using CBPF-zphot, including the red sequence objects. The red-faint objects from S1506 completely fill the under-dense region in the faint-red-end and are homogenously distributed out to 5 × R200. Similar as Figure 11 symbols represent the parent sample, spectroscopic objects and the photometric selected Abell 500 galaxy cluster candidate members in grey, yellow and blue respectively. We now include in magenta symbols the faint-red objects added through the faint-red sequence fit (see Section 3.2 for details). The upper panels show from left to right, the spectroscopic redshift distribution(zspec), the zphot − mr diagram and relevant cluster information including the parent sample, total number of galaxy cluster selected objects, the confirmed spectroscopic cluster members (open circles), and the spectroscopically confirmed cluster members and spectroscopic objects within the cluster redshift range (yellow crosses) that were not selected by our method. The lower panels show from left to right the zspec − zphot diagram, along with the CMD and SSD. The red sequence-fit selected objects successfully fill in the faint-end, under-dense region and are homogenously distributed within 5 × R200.
Current usage metrics show cumulative count of Article Views (full-text article views including HTML views, PDF and ePub downloads, according to the available data) and Abstracts Views on Vision4Press platform.
Data correspond to usage on the plateform after 2015. The current usage metrics is available 48-96 hours after online publication and is updated daily on week days.
Initial download of the metrics may take a while.