Fig. 14.
Download original image
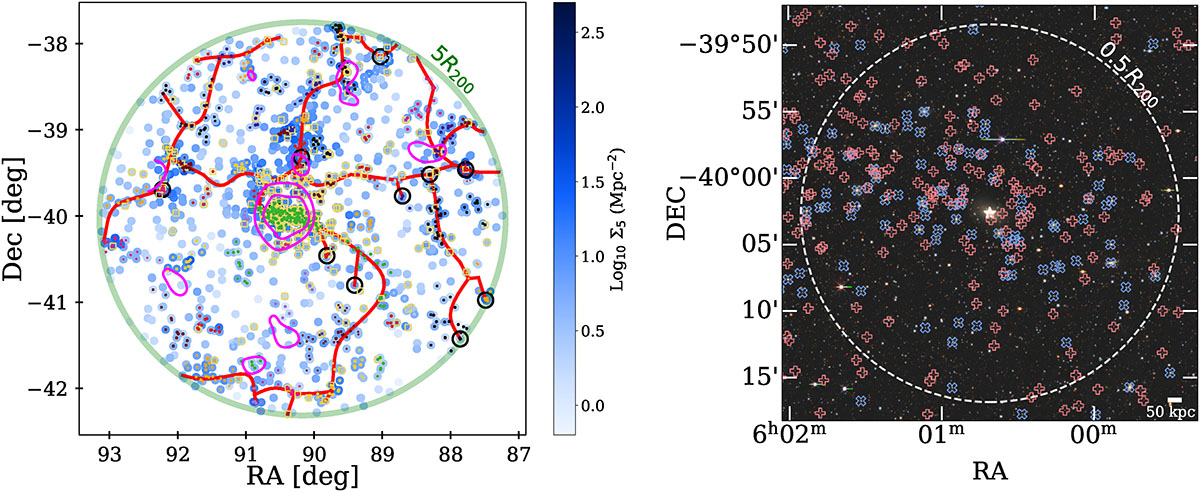
Left panel: LSS and substructures identification in A3376. Blue colour bar shows the local galaxy density with KNN of photometric members that are part of the cluster. Yellow squares are the spectral members. The identified filaments are represented as red lines, where nodes are indicated as black dots. Green circumference is 5 × R200. Magenta contours are eROSITA large-scale X-ray detections in the cluster area. The identified substructures are plotted with different colours. Right panel: RGB cutout of A3376 the central region (0.5 × R200, dashed circle ), overlaid their corresponding galaxy cluster candidate members from S1501 (blue open plus symbols), S1505 (red open cross symbols) and the brightest cluster galaxy (BCG, white star) can be found.
Current usage metrics show cumulative count of Article Views (full-text article views including HTML views, PDF and ePub downloads, according to the available data) and Abstracts Views on Vision4Press platform.
Data correspond to usage on the plateform after 2015. The current usage metrics is available 48-96 hours after online publication and is updated daily on week days.
Initial download of the metrics may take a while.