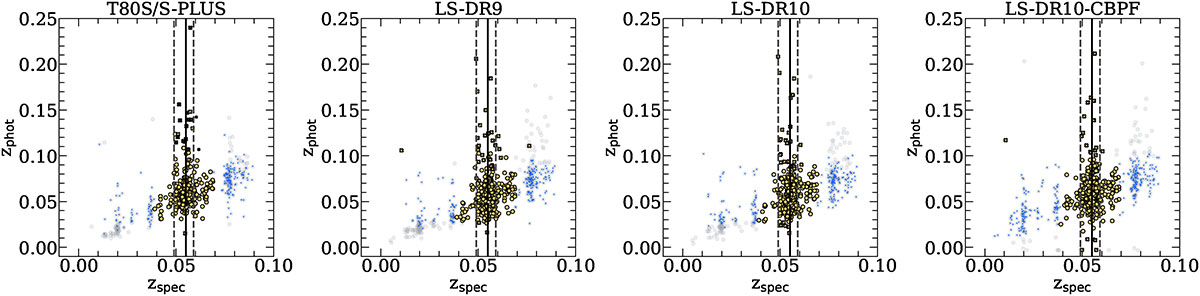
Fig. 5.
Download original image
Photometric redshift versus spectroscopic redshift for each set of photometric redshifts, from left to right: T80S/S-PLUS, LS-DR9, LS-DR10 and LS-DR10-CBPF. We include the corresponding parent sample (grey circles), the A0085 galaxy cluster candidate members selected from our photometric method (blue), the spectroscopically confirmed members (yellow circles), and the confirmed spectroscopic cluster members and spectroscopic objects within the cluster redshift range (yellow crosses) that were not selected by our method. The solid black vertical-line indicates the cluster redshift obtained from the mean spectroscopic redshift distribution, while the dashed vertical-lines indicate the cluster lower and upper limits.
Current usage metrics show cumulative count of Article Views (full-text article views including HTML views, PDF and ePub downloads, according to the available data) and Abstracts Views on Vision4Press platform.
Data correspond to usage on the plateform after 2015. The current usage metrics is available 48-96 hours after online publication and is updated daily on week days.
Initial download of the metrics may take a while.