Fig. 8.
Download original image
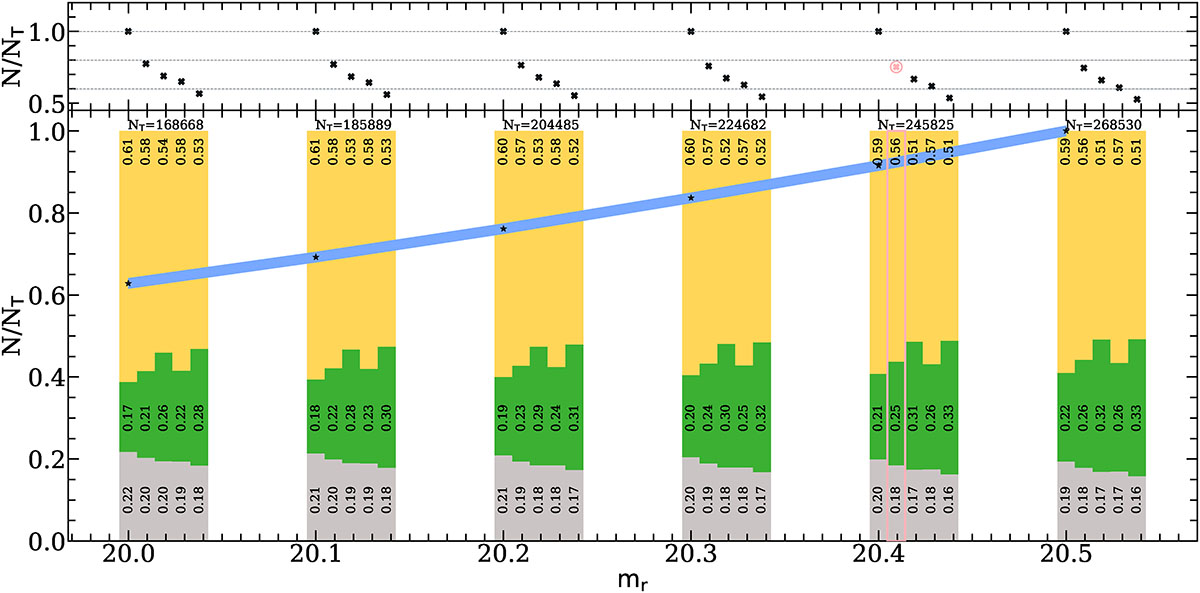
Total number of selected objects (NT) for the faint-end (mr ≥ 18.5) regime by adopting different N × σNMAD combinations for T80S/S-PLUS and LS-DR10-CBPF galaxy cluster candidate members selection and imposing different mr-limit values (20, 20.1, 20.2, 20.3, 20.4 and 20.5). The lower panel show a set of 5 different N × σNMAD combinations within the mr range of 20-20.5. The leftmost column of each set corresponds to target selections adopting N × σNMAD = 4 for both T80S/S-PLUS and LS-DR10-CBPF, followed by the N × σNMAD combinations (from left to right): 3.5/3.0, 3.5/2.5, 3.0/2.5; and 3.0/2.0 for T80S/S-PLUS and LS-DR10-CBPF respectively. As a reference NT number (NT) of selected objects is included on top of each mr-limited set considering N × σNMAD = 4 for both T80S/S-PLUS and CBPF surveys. The blue line highlights how NT varies as a function of mr, if mr = 20.5 (N/NT = 1) is considered NT is reduced to 60% at mr-limit = 20. Each bar is decomposed by their corresponding parent survey catalogue: T80S/S-PLUS (green), CBPF (yellow) and common objects selected by both surveys(grey). The upper panel shows how the different N × σNMAD adopted combinations for T80S/S-PLUS and LS-DR10-CBPF affect NT at each mr-limit bin, considering N × σNMAD = 4 as a reference (N/NT = 1). At all mr bins the number of objects is reduced for the different N × σNMAD combinations, dropping down to a ≲60% of the selected objects at N × σNMAD-combination: 3.0, 2.0 for T80S/S-PLUS and LS-DR10-CBPF, respectively. The final mr-limit at = 20.4 and N × σNMAD-combination 3.5/T80S/S-PLUS and 3.0/ LS-DR10-CBPF adopted to compile the Low-z faint (S1505) and Low-z faint suplementary (S1506) catalogues is highlighted in red.
Current usage metrics show cumulative count of Article Views (full-text article views including HTML views, PDF and ePub downloads, according to the available data) and Abstracts Views on Vision4Press platform.
Data correspond to usage on the plateform after 2015. The current usage metrics is available 48-96 hours after online publication and is updated daily on week days.
Initial download of the metrics may take a while.