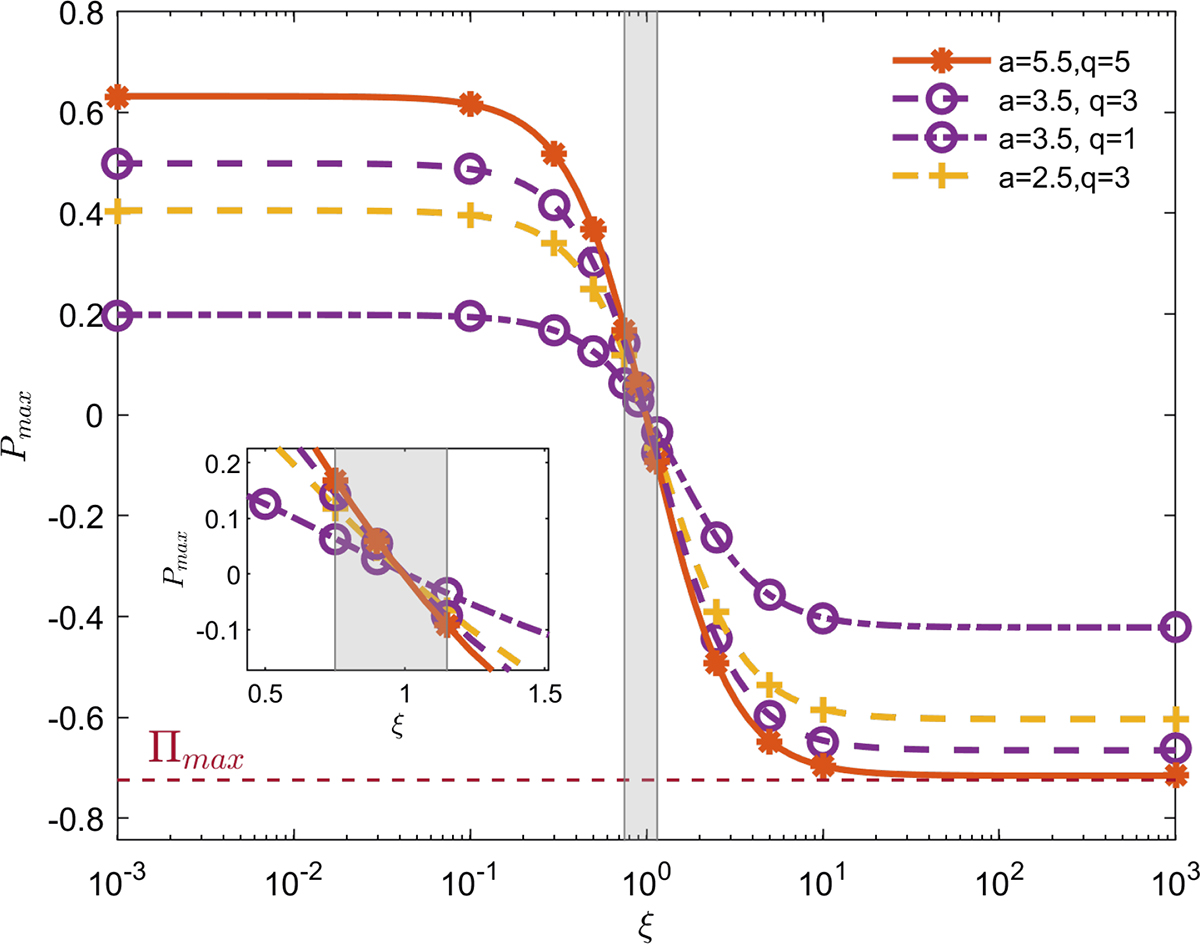
Fig. 7.
Download original image
Maximal polarization degree Pmax as a function of the magnetic field stretching factor ξ, in which synchrotron radiation is emitted. This relation is plotted for four combinations of the jet energy angular profile power-law index a and normalized viewing angle q, and is well described by a hyperbolic tangent of log10ξ for all values. The region of ξ imposed by the upper limits on the polarization of GW 170817 (0.75 < ξ < 1.15; Gill & Granot 2018, 2020; B24) is marked in shaded gray. The inset shows a zoomed-in image of this region. All curves change sign at ξ = 1. Detailed models can be found in Table A.1.
Current usage metrics show cumulative count of Article Views (full-text article views including HTML views, PDF and ePub downloads, according to the available data) and Abstracts Views on Vision4Press platform.
Data correspond to usage on the plateform after 2015. The current usage metrics is available 48-96 hours after online publication and is updated daily on week days.
Initial download of the metrics may take a while.