Fig. 8.
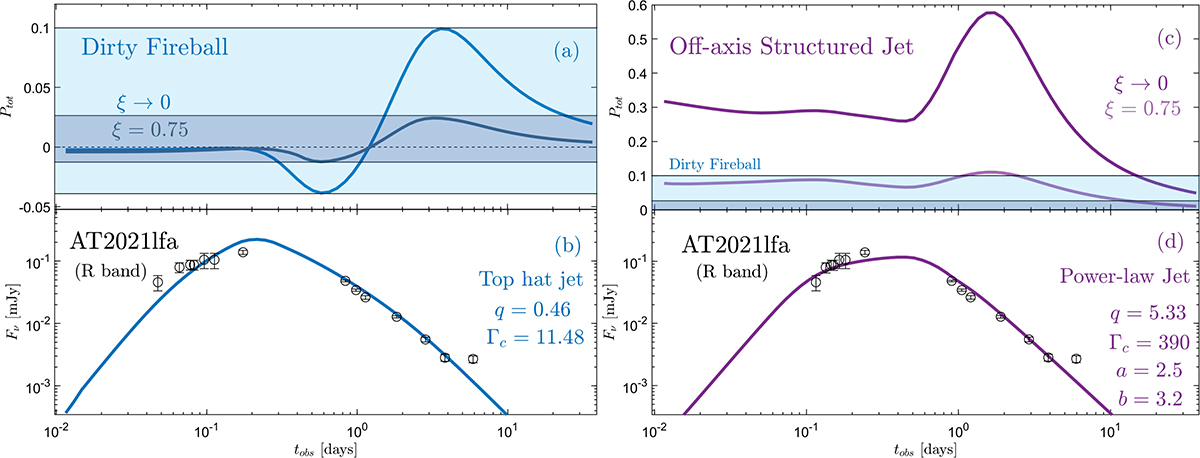
Download original image
Upper panels: Observed polarization curves corresponding to the dirty fireball (panel (a)) and off-axis structured jet (panel (c)) models for the R-band (optical) light curve of AT2021lfa. Polarization curves are presented for two values for the magnetic field stretching factor ξ: a random magnetic field confined to the plane of the shock (ξ → 0) and the more realistic ξ = 0.75, which also has a slightly weaker radial component. The ξ → 0 models exhibit higher polarization than the ξ = 0.75 models. The peak levels of polarization of the dirty fireball scenario are marked with blue (for ξ → 0) and dark blue (for ξ = 0.75) shading, for comparison with the off-axis structured jet scenario. Lower panels: Observed R-band flux for AT2021lfa (black data points, taken from MASTER-OAFA and ZTF; Lipunov et al. 2021, 2022; Yao et al. 2021b), and computed light curves according to the dirty fireball (panel (b), solid blue lines) and off-axis structured jet (panel (d), solid purple lines). Both models are able to describe the trends seen in the flux observations, while having very different geometrical parameters. Detailed afterglow parameters can be found in Table 2.
Current usage metrics show cumulative count of Article Views (full-text article views including HTML views, PDF and ePub downloads, according to the available data) and Abstracts Views on Vision4Press platform.
Data correspond to usage on the plateform after 2015. The current usage metrics is available 48-96 hours after online publication and is updated daily on week days.
Initial download of the metrics may take a while.