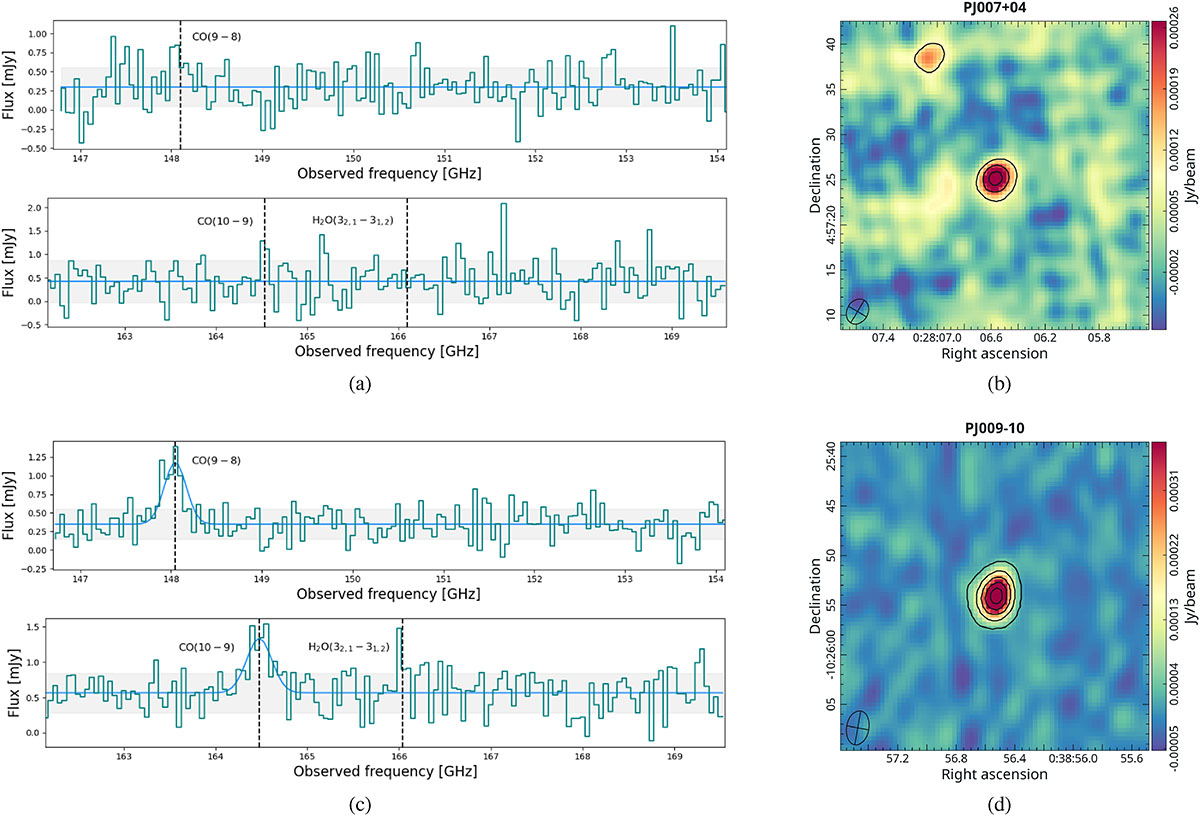
Fig. B.1.
Download original image
NOEMA Band 2 spectra and dust continuum maps for the QSOs PJ007+04 and PJ009-10. The clean beam is reported in the bottom left corner of each continuum map. Panel (a): spectrum of the QSO PJ007+04 extracted over a region corresponding to the clean beam, with channel widths of 50 km/s. The light blue curve represents the fitted model, consisting of a constant continuuum and, in case of detection, some Gaussian line components. Panel (b): 158 GHz dust continuum map of the QSO PJ007+04 (contours at 3, 6 and 9 σ). Panel (c): same as panel (a) but for the QSO PJ009-10. Panel (d): same as panel (b) but for the QSO PJ009-10 (contours at 3, 9, 15, 21 and 27 σ).
Current usage metrics show cumulative count of Article Views (full-text article views including HTML views, PDF and ePub downloads, according to the available data) and Abstracts Views on Vision4Press platform.
Data correspond to usage on the plateform after 2015. The current usage metrics is available 48-96 hours after online publication and is updated daily on week days.
Initial download of the metrics may take a while.