Fig. 4.
Download original image
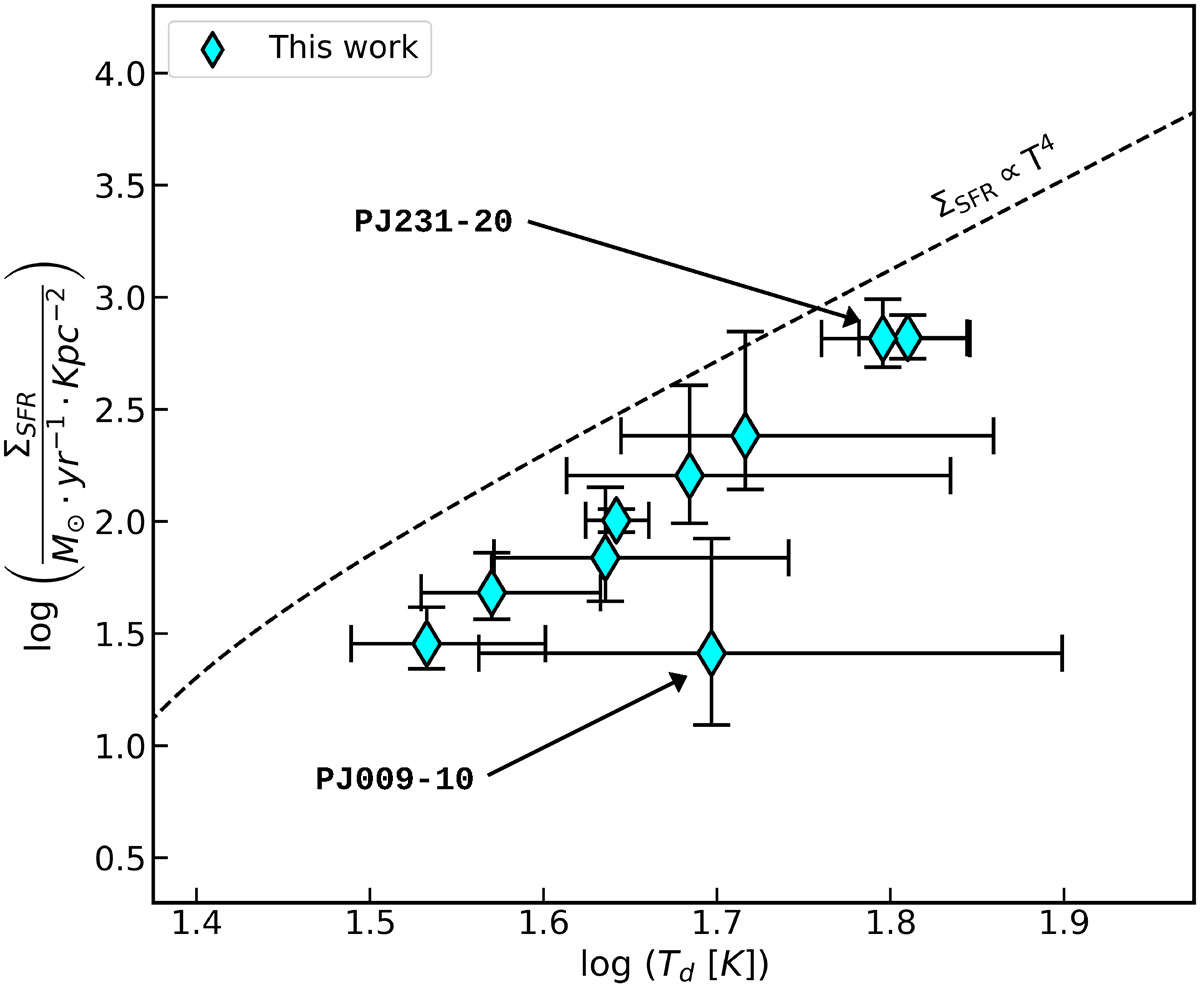
Dust temperature vs SFR surface density. The dashed black line corresponds to the relation obtained by analytically integrating Equation (3) under optically thick conditions and assuming a z = 6.5 background CMB radiation field. The two sources indicated by the arrows are PJ009−10 and PJ231−20, which show the lowest and highest value of τ1900, respectively.
Current usage metrics show cumulative count of Article Views (full-text article views including HTML views, PDF and ePub downloads, according to the available data) and Abstracts Views on Vision4Press platform.
Data correspond to usage on the plateform after 2015. The current usage metrics is available 48-96 hours after online publication and is updated daily on week days.
Initial download of the metrics may take a while.