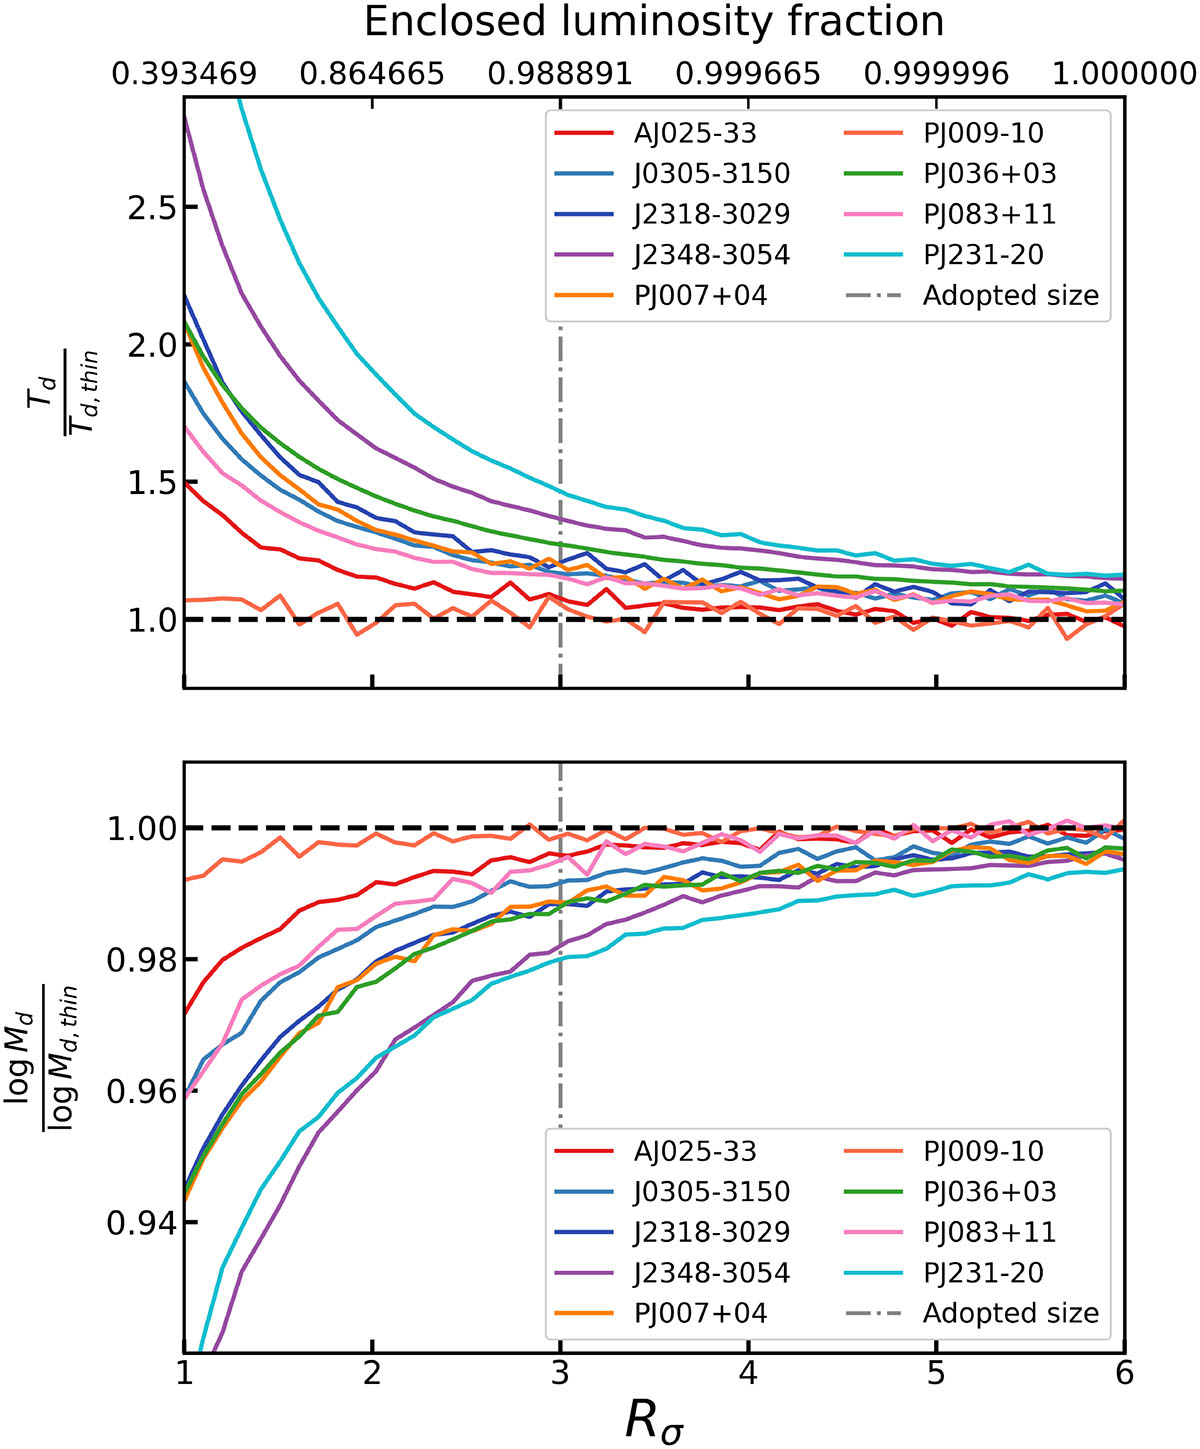
Fig. 5.
Download original image
Median values of the Td and Md posterior probability distribution as functions of the assumed size, normalized to the optically thin results. The dashed line marks the asymptotic limit of 1 expected for low optical depth. The upper x-axis shows the fractional luminosity enclosed within the corresponding σ distance from the Gaussian peak.
Current usage metrics show cumulative count of Article Views (full-text article views including HTML views, PDF and ePub downloads, according to the available data) and Abstracts Views on Vision4Press platform.
Data correspond to usage on the plateform after 2015. The current usage metrics is available 48-96 hours after online publication and is updated daily on week days.
Initial download of the metrics may take a while.