Fig. 6.
Download original image
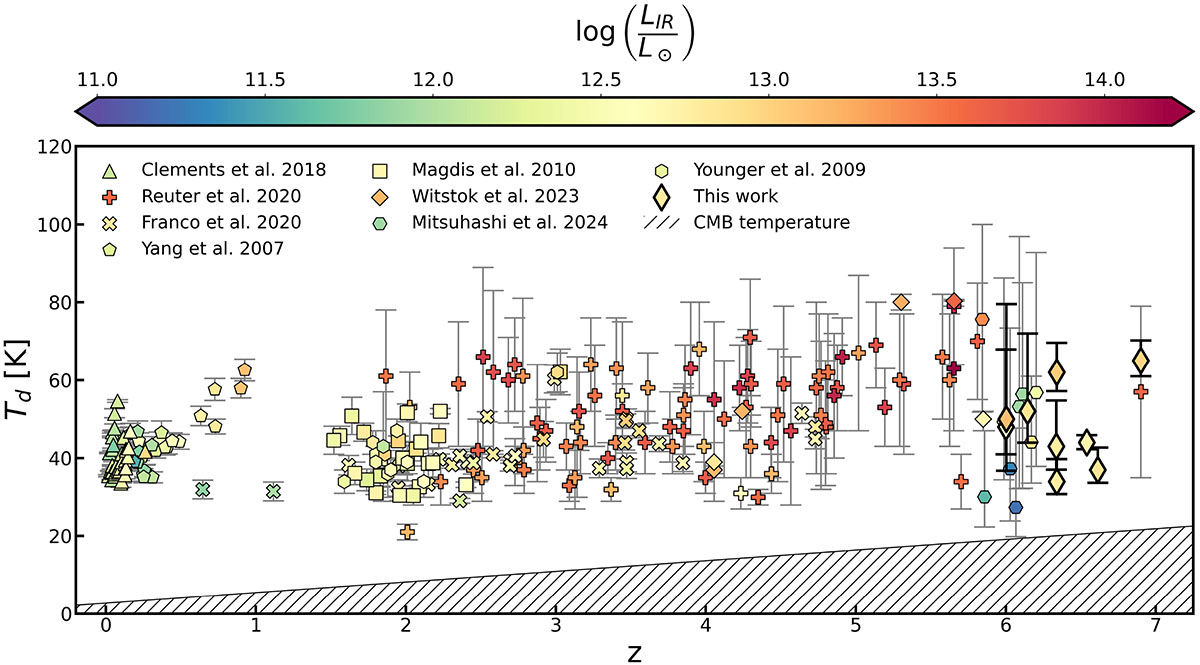
Dust temperature versus redshift in a sample of LIRGs, ULIRGs and HLIRGs, and in our QSOs. The dashed area corresponds to the CMB temperature. Data from Yang et al. (2007), Younger et al. (2009), Magdis et al. (2010), Clements et al. (2018), Franco et al. (2020), Reuter et al. (2020), Witstok et al. (2023), Mitsuhashi et al. (2024).
Current usage metrics show cumulative count of Article Views (full-text article views including HTML views, PDF and ePub downloads, according to the available data) and Abstracts Views on Vision4Press platform.
Data correspond to usage on the plateform after 2015. The current usage metrics is available 48-96 hours after online publication and is updated daily on week days.
Initial download of the metrics may take a while.