Fig. 3
Download original image
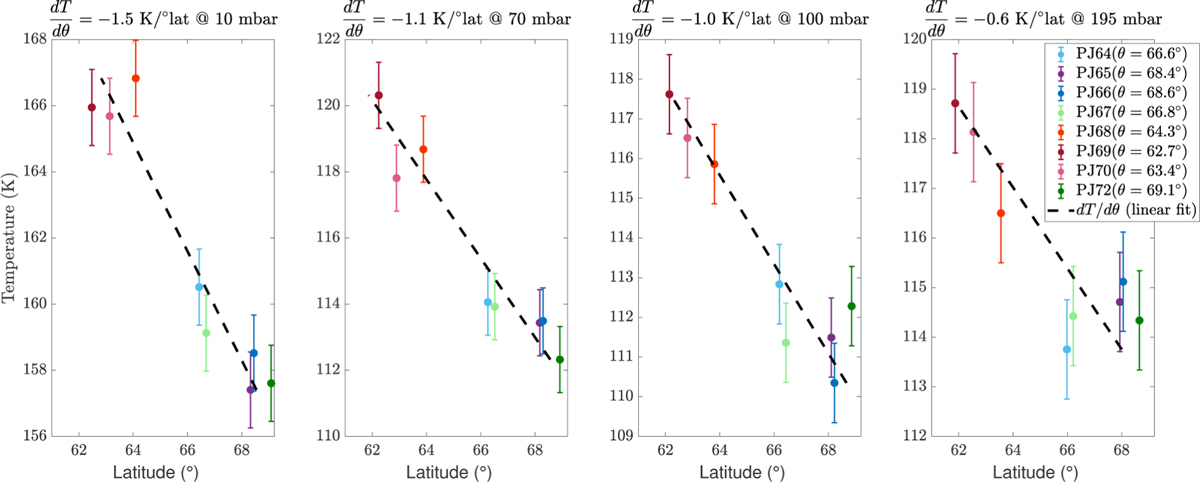
Temperature at four pressure levels (10, 70, 100, and 195 mbar) from each radio occultation profile. Gradient strength across the vortex boundary is quantified and stated in each subplot title. The error bars at each level indicate the total uncertainties comprised from the upper temperature boundary, noise, trajectory uncertainties, and cloud wind considerations (uncertainty estimation description in Sect. 2).
Current usage metrics show cumulative count of Article Views (full-text article views including HTML views, PDF and ePub downloads, according to the available data) and Abstracts Views on Vision4Press platform.
Data correspond to usage on the plateform after 2015. The current usage metrics is available 48-96 hours after online publication and is updated daily on week days.
Initial download of the metrics may take a while.