Fig. 4
Download original image
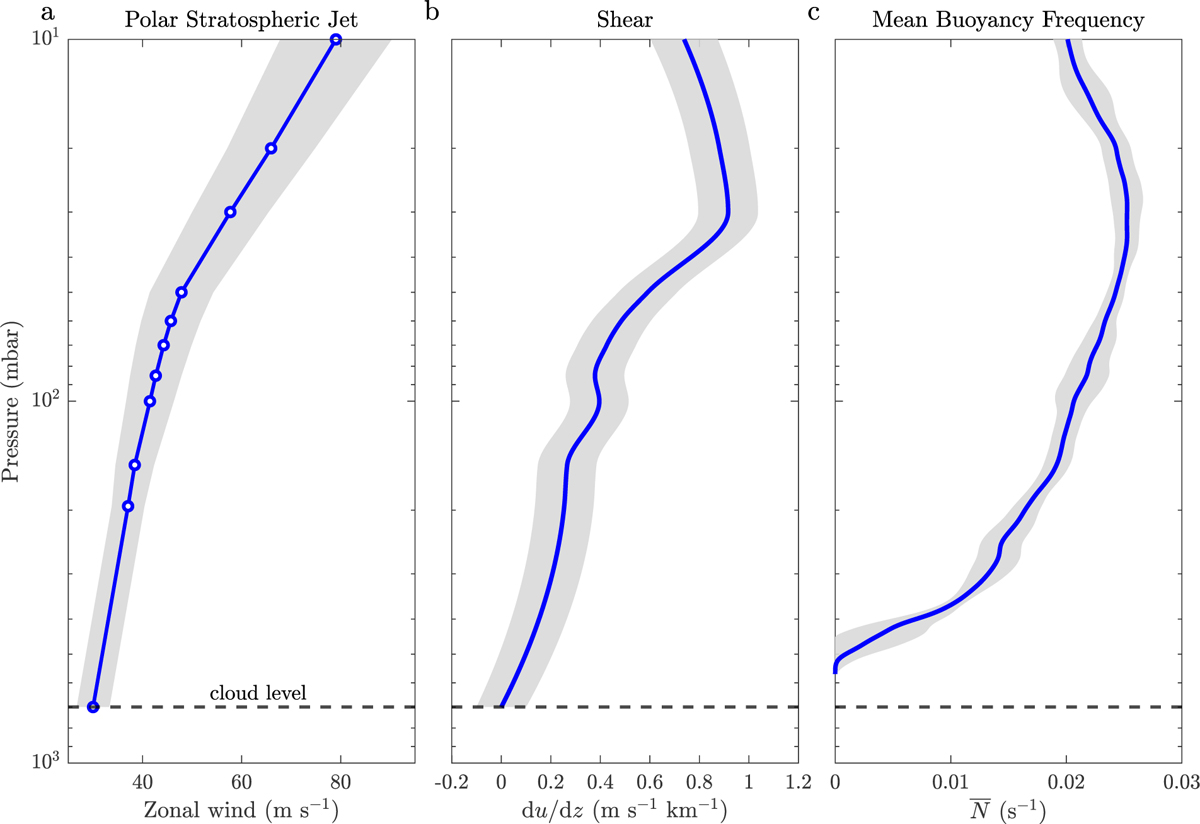
Vertical inferred zonal wind velocity (panel a) and shear (du/dz) profiles (panel b) calculated from the temperature structure using the thermal wind equation. Wind velocities are shown from the cloud tops at 0.7 bar to 10 mbar. The shading indicates the uncertainty envelope, propagated from the temperature inversions (uncertainty estimation description in Sect. 2). Panel c: mean Brunt-Väisälä (buoyancy) frequency (N) in the lower stratosphere and upper troposphere region where the shading indicates the envelope of variability of the individual profiles.
Current usage metrics show cumulative count of Article Views (full-text article views including HTML views, PDF and ePub downloads, according to the available data) and Abstracts Views on Vision4Press platform.
Data correspond to usage on the plateform after 2015. The current usage metrics is available 48-96 hours after online publication and is updated daily on week days.
Initial download of the metrics may take a while.