Open Access
Fig. D.1
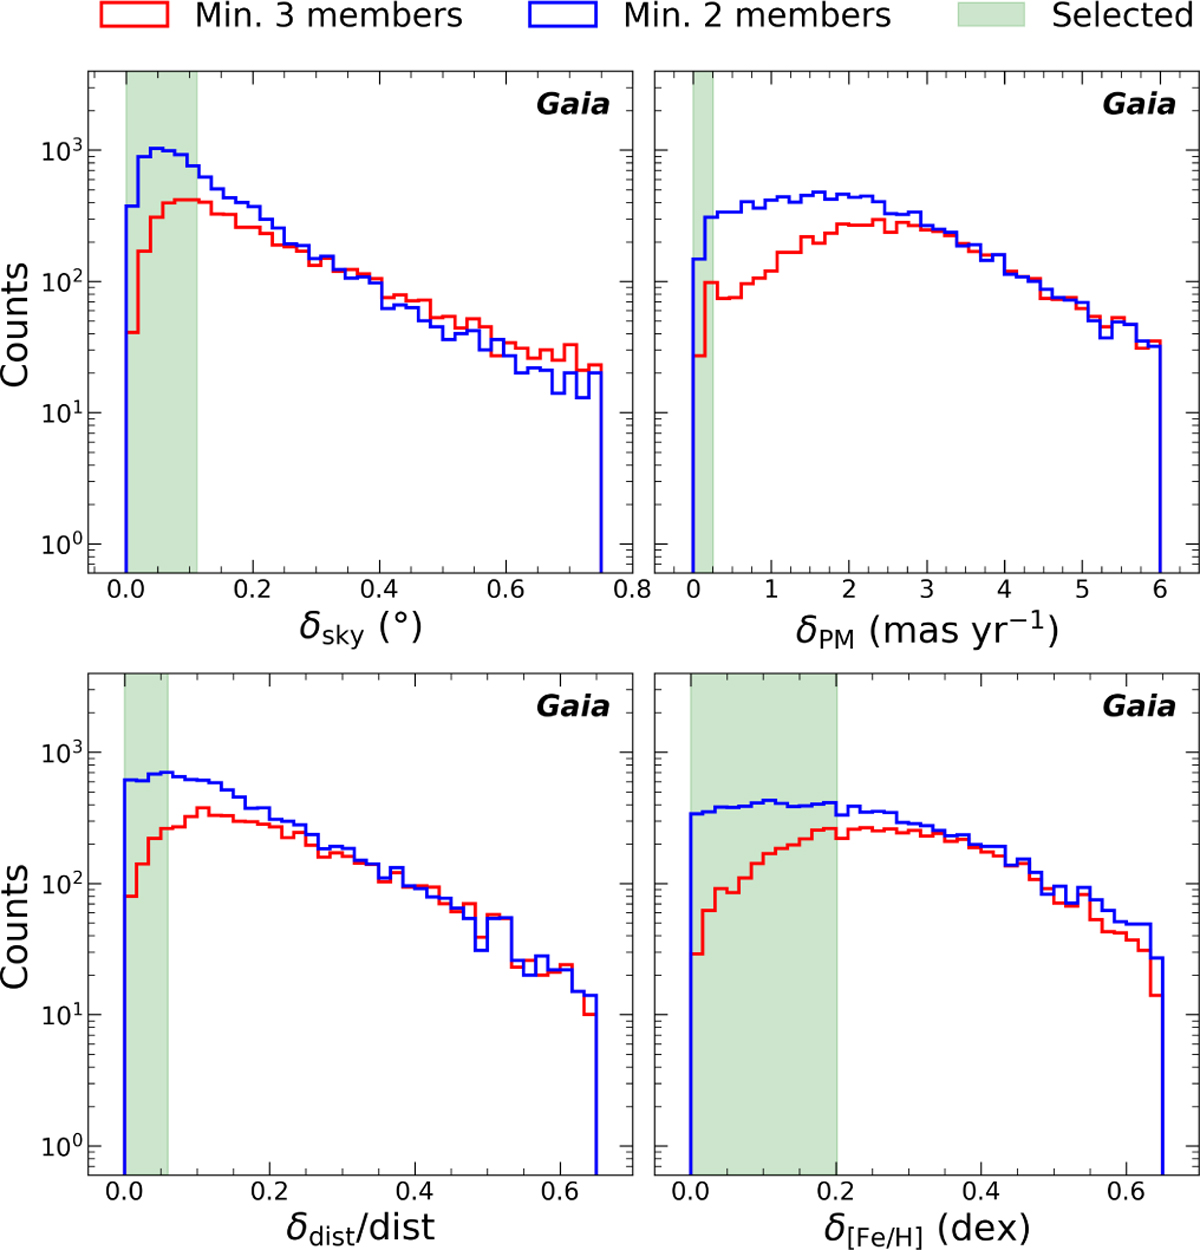
Download original image
Same as Fig. 3, but comparing the metric distributions obtained for the Gaia sample when using min_cluster_size values of two (blue histograms) and three (red histograms).
Current usage metrics show cumulative count of Article Views (full-text article views including HTML views, PDF and ePub downloads, according to the available data) and Abstracts Views on Vision4Press platform.
Data correspond to usage on the plateform after 2015. The current usage metrics is available 48-96 hours after online publication and is updated daily on week days.
Initial download of the metrics may take a while.