Fig. 2
Download original image
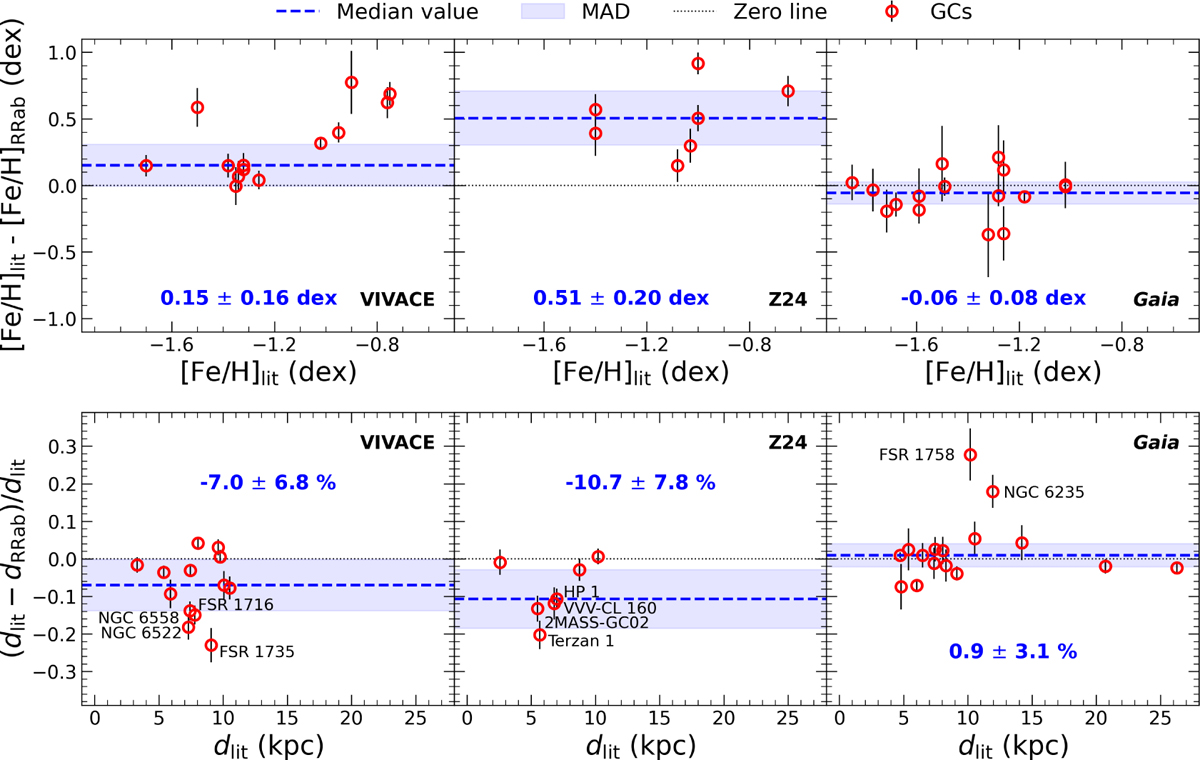
Comparison of the clusters' [Fe/H] (upper panels) and distance (lower panels) values derived from their RRab stars and their values from the literature. Clusters in the VIVACE, Z24, and Gaia samples are shown in the left, center, and right panels, respectively. The black dotted lines show the zero functions, while the median and MAD of the y-axis values in each panel are highlighted in blue text and as a blue line and shaded region, respectively. The y-axis error bars shown in the upper panels correspond to the errors in our [Fe/H] estimates, while the y-axis error bars in the lower panels correspond to the errors in the RRab-based distances divided by the nominal values from the literature. Clusters with relative distance differences greater than 10% have their names highlighted in the lower panels.
Current usage metrics show cumulative count of Article Views (full-text article views including HTML views, PDF and ePub downloads, according to the available data) and Abstracts Views on Vision4Press platform.
Data correspond to usage on the plateform after 2015. The current usage metrics is available 48-96 hours after online publication and is updated daily on week days.
Initial download of the metrics may take a while.