Fig. 3
Download original image
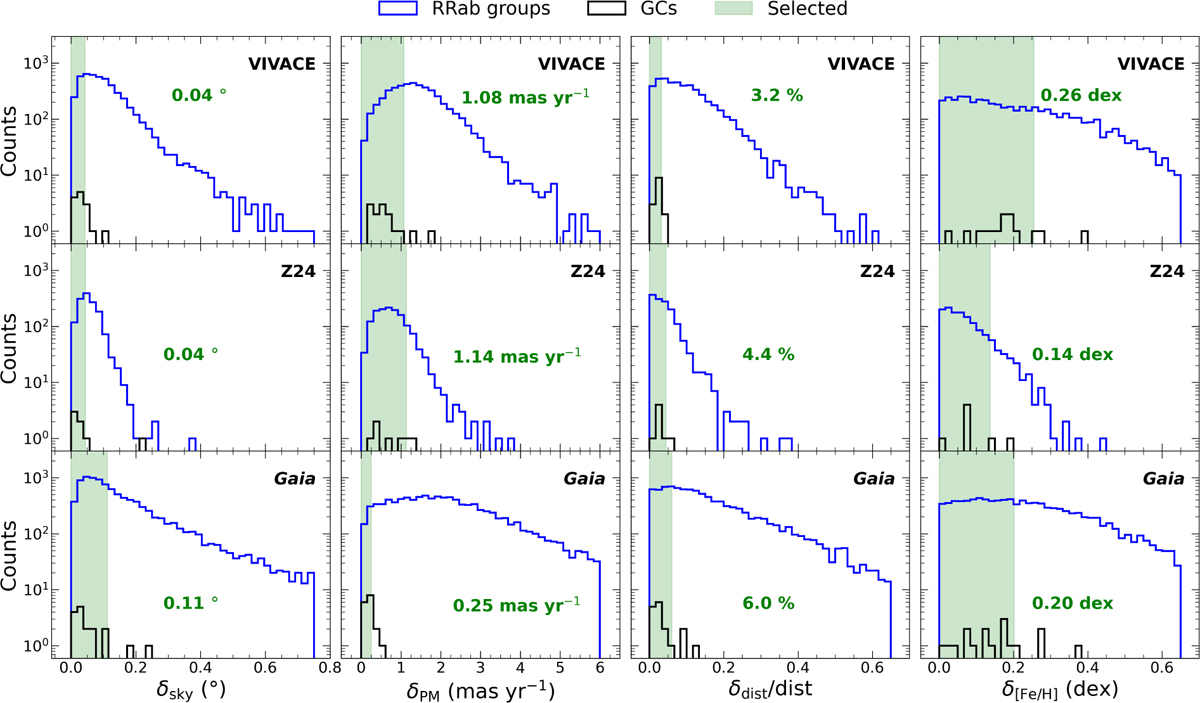
Metric distributions of all the RRab groups (blue histograms) obtained, compared with the metrics of the cleaned GCs in our calibrating sample (black histograms) in the VIVACE, Z24, and Gaia samples (upper, middle, and lower panels, respectively). Metric regions that satisfy our cuts are displayed with light-green shaded areas, with the cut threshold of each panel highlighted in green text.
Current usage metrics show cumulative count of Article Views (full-text article views including HTML views, PDF and ePub downloads, according to the available data) and Abstracts Views on Vision4Press platform.
Data correspond to usage on the plateform after 2015. The current usage metrics is available 48-96 hours after online publication and is updated daily on week days.
Initial download of the metrics may take a while.