Fig. B.1
Download original image
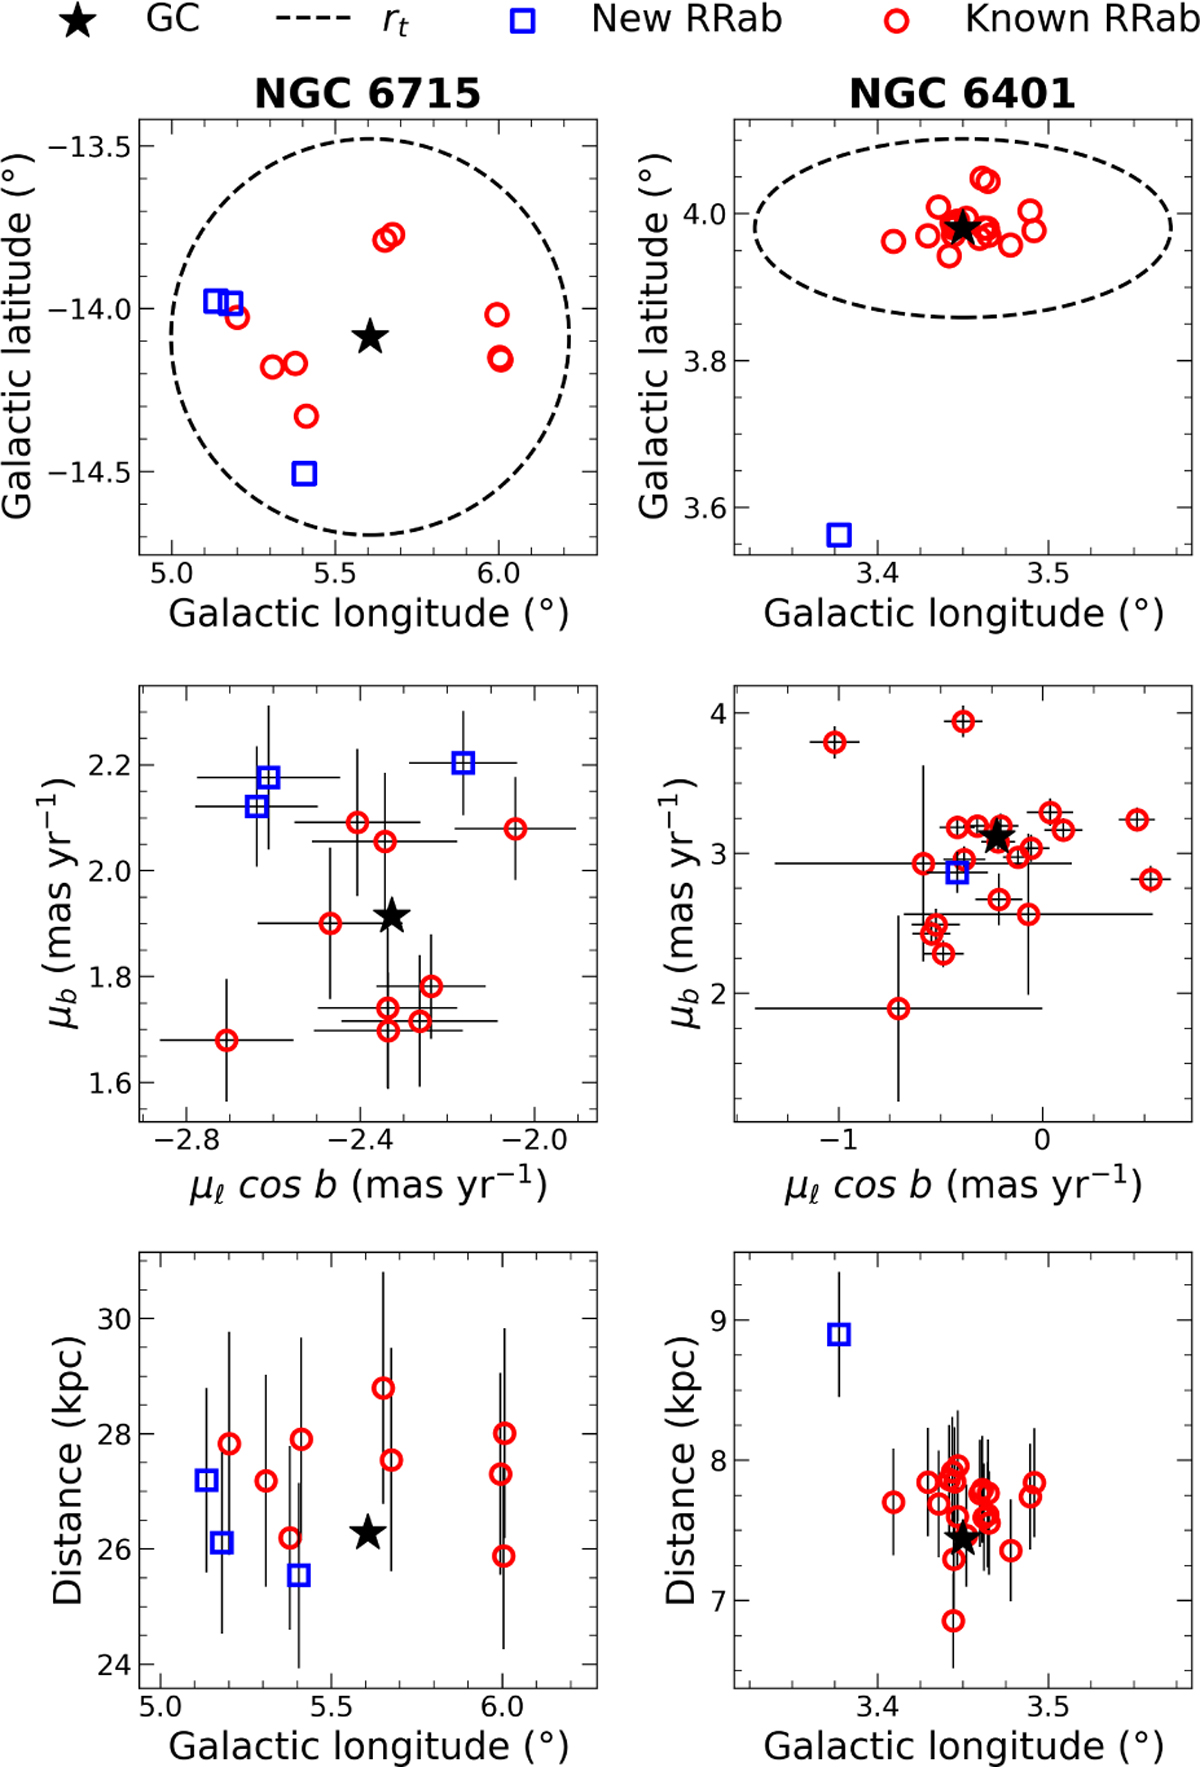
Overview of the proposed new GC members found with our clustering procedure. The parameters of the GCs are shown as black stars, while their known RRab members in our quality samples are depicted with red circles and their proposed new RRab members as blue squares. Additionally, the tidal radii of the GCs (rt, from the GGCD) are represented by black-dashed circles in the top panels.
Current usage metrics show cumulative count of Article Views (full-text article views including HTML views, PDF and ePub downloads, according to the available data) and Abstracts Views on Vision4Press platform.
Data correspond to usage on the plateform after 2015. The current usage metrics is available 48-96 hours after online publication and is updated daily on week days.
Initial download of the metrics may take a while.