Fig. 1.
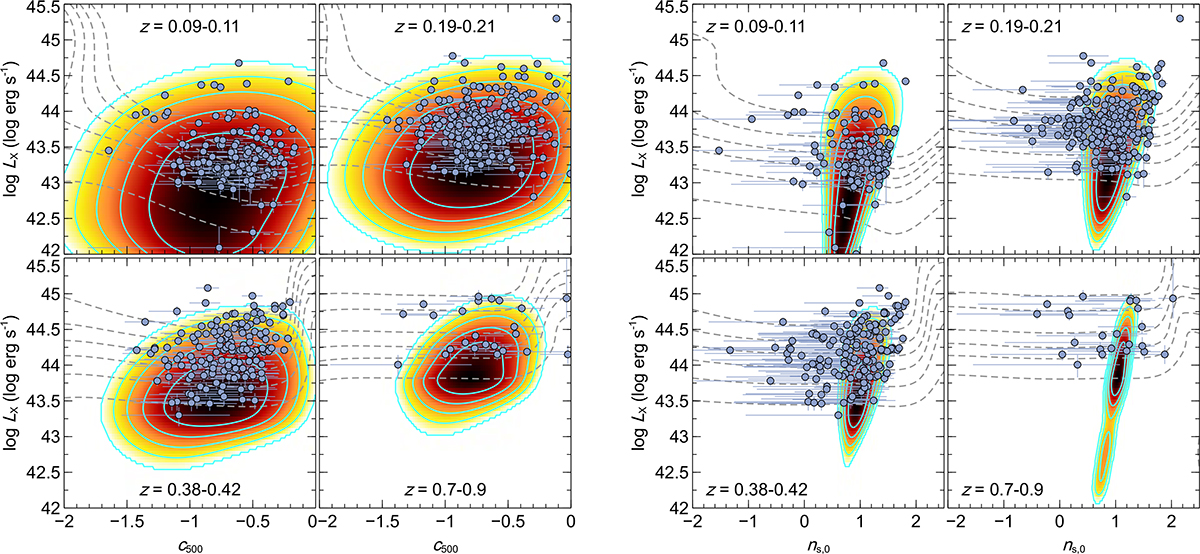
Download original image
Clusters with > 50 counts plotted on PDFs combining the maximum likelihood scaling relation, selection function, and mass function. The clusters in four redshift bins are shown, plotting the concentration, c500 (left), and scaled density, ns, 0 (right). The images show the average maximum likelihood scaling relation combined with the selection function and mass function for the clusters in the redshift ranges, with the solid contour lines at difference levels of −2, −4, −6, −8, and −10 from the maximum. The dashed contour lines show the average selection function, at levels of 0.05, 0.2, 0.4, 0.6, 0.8, and 0.95.
Current usage metrics show cumulative count of Article Views (full-text article views including HTML views, PDF and ePub downloads, according to the available data) and Abstracts Views on Vision4Press platform.
Data correspond to usage on the plateform after 2015. The current usage metrics is available 48-96 hours after online publication and is updated daily on week days.
Initial download of the metrics may take a while.