Fig. 2.
Download original image
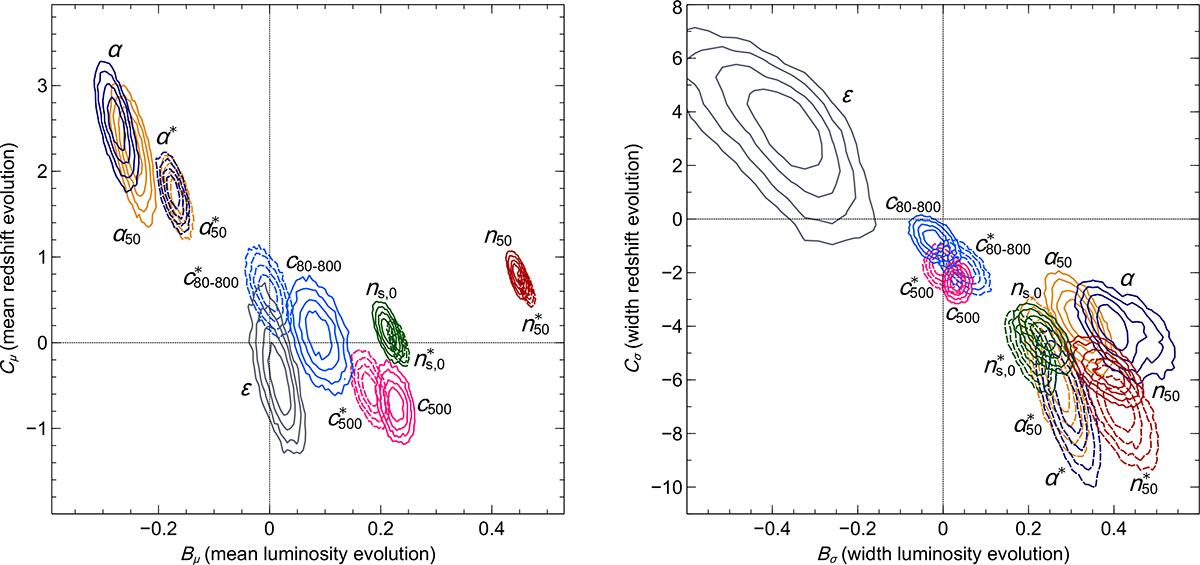
Evolution of mean and width for several parameters. Left: confidence contours for the evolution of μ, with the results using the cluster fit positions shown as solid lines and the peak-centred cluster results shown as dashed lines. Right: confidence contours of the evolution of σ. The contours contain 39.3, 67.5, 86.4, and 95% of the MCMC samples. See Appendix C for corner plots of the other parameters.
Current usage metrics show cumulative count of Article Views (full-text article views including HTML views, PDF and ePub downloads, according to the available data) and Abstracts Views on Vision4Press platform.
Data correspond to usage on the plateform after 2015. The current usage metrics is available 48-96 hours after online publication and is updated daily on week days.
Initial download of the metrics may take a while.