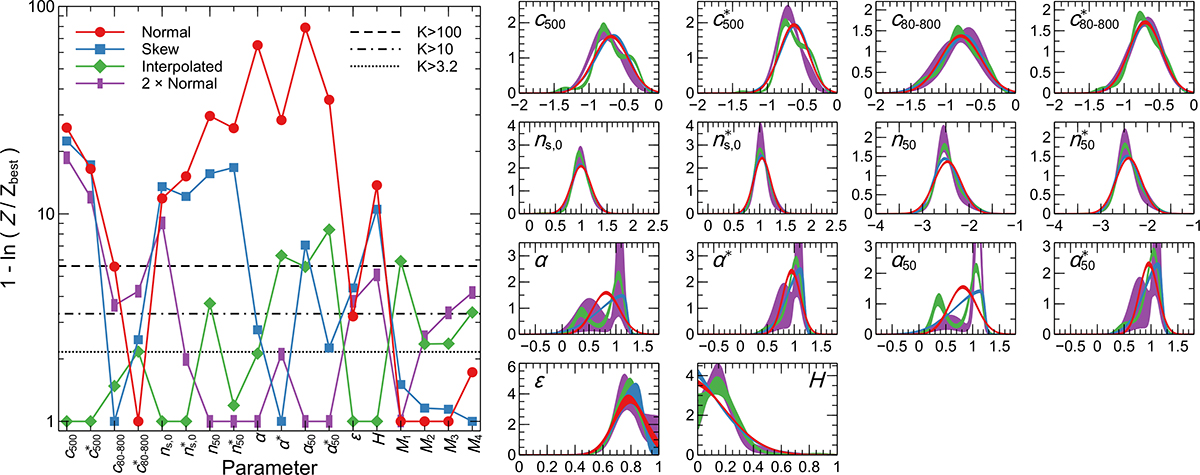
Fig. 4.
Download original image
Comparison of different distribution models for the whole sample. Left panel: model comparison, as in Fig. 3, for each parameter, assuming that the clusters have a single distribution. Models with greater evidence have lower values. Right panels: PDFs of each parameter, for each of the model types, coloured as in the left panel. The shaded regions contain 68.27% of the samples.
Current usage metrics show cumulative count of Article Views (full-text article views including HTML views, PDF and ePub downloads, according to the available data) and Abstracts Views on Vision4Press platform.
Data correspond to usage on the plateform after 2015. The current usage metrics is available 48-96 hours after online publication and is updated daily on week days.
Initial download of the metrics may take a while.