Fig. 5.
Download original image
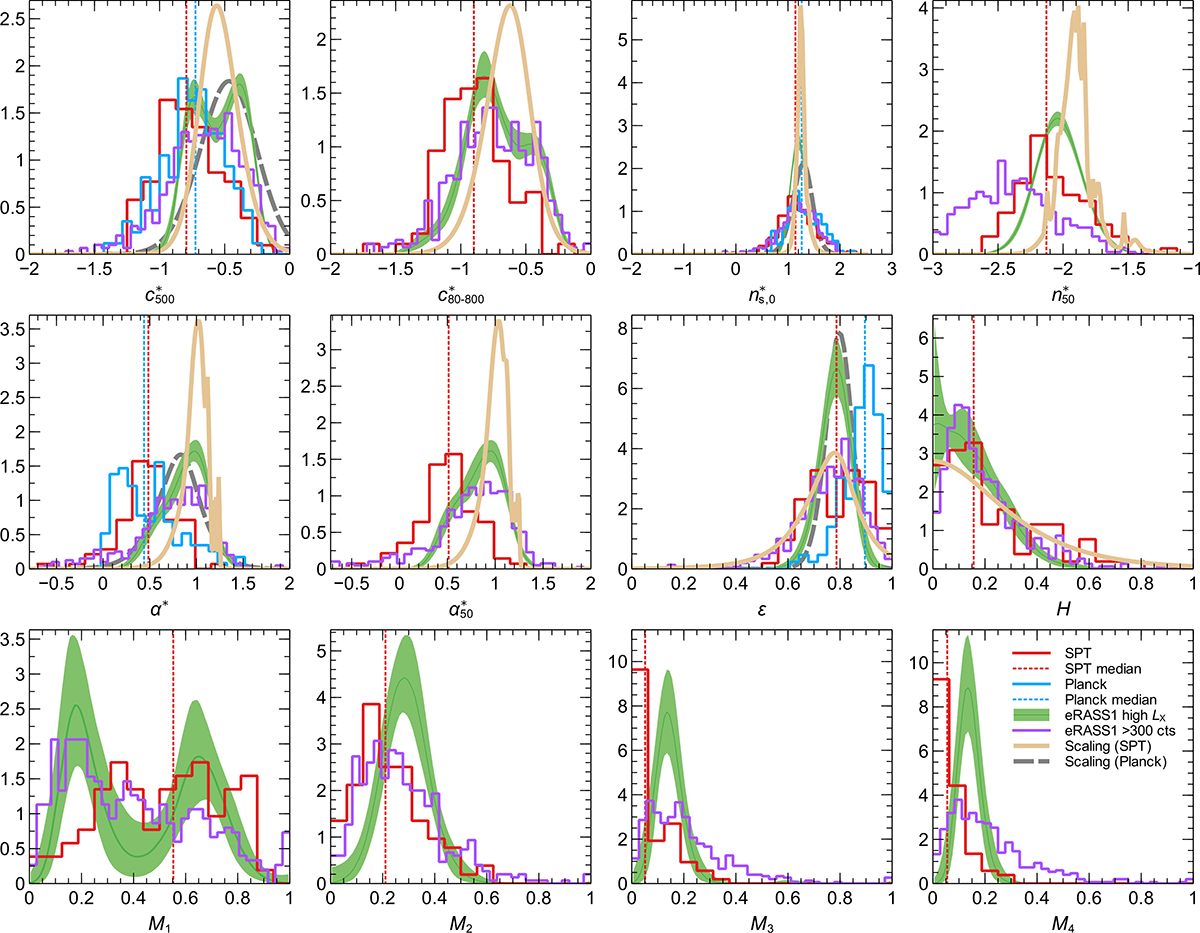
Comparison of eRASS1 probability densities compared to SPT- and Planck-selected samples. The distribution of the parameters for the Chandra-SPT sample is plotted as a histogram, with the median value indicated by a dashed line. The Planck values are for ESZ clusters from Lovisari et al. (2017). The model distribution for the eRASS1 clusters in the high luminosity bin is plotted (log LX = 44.3 − 45.6, fitted using interpolated model). For those parameters where we fitted a scaling relation (Appendix C), we computed matched PDFs given the redshift and luminosities of the SPT and Planck samples. The distributions of parameter values for the bright 300 count cluster eRASS1 subset are also plotted.
Current usage metrics show cumulative count of Article Views (full-text article views including HTML views, PDF and ePub downloads, according to the available data) and Abstracts Views on Vision4Press platform.
Data correspond to usage on the plateform after 2015. The current usage metrics is available 48-96 hours after online publication and is updated daily on week days.
Initial download of the metrics may take a while.