Open Access
Fig. B.1.
Download original image
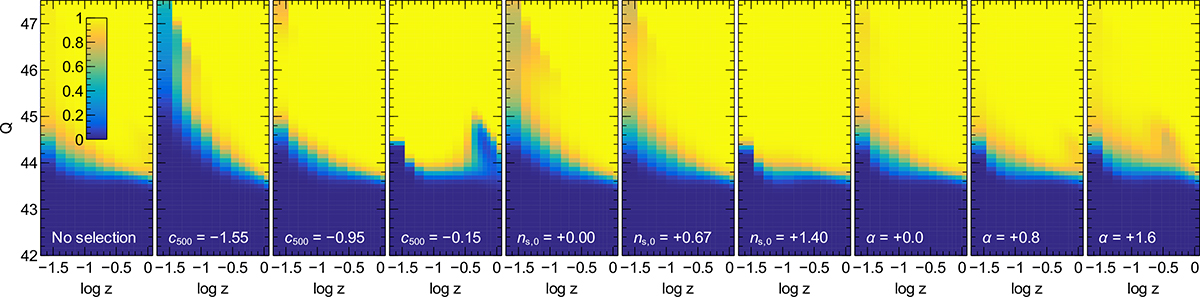
Selection function for different morphological selections. The selection function model for the 50 count subsample is shown as a function of Q and log z. From left to right, are shown no morphological selection, and selection for low, medium and high values of c500, ns, 0, and α.
Current usage metrics show cumulative count of Article Views (full-text article views including HTML views, PDF and ePub downloads, according to the available data) and Abstracts Views on Vision4Press platform.
Data correspond to usage on the plateform after 2015. The current usage metrics is available 48-96 hours after online publication and is updated daily on week days.
Initial download of the metrics may take a while.