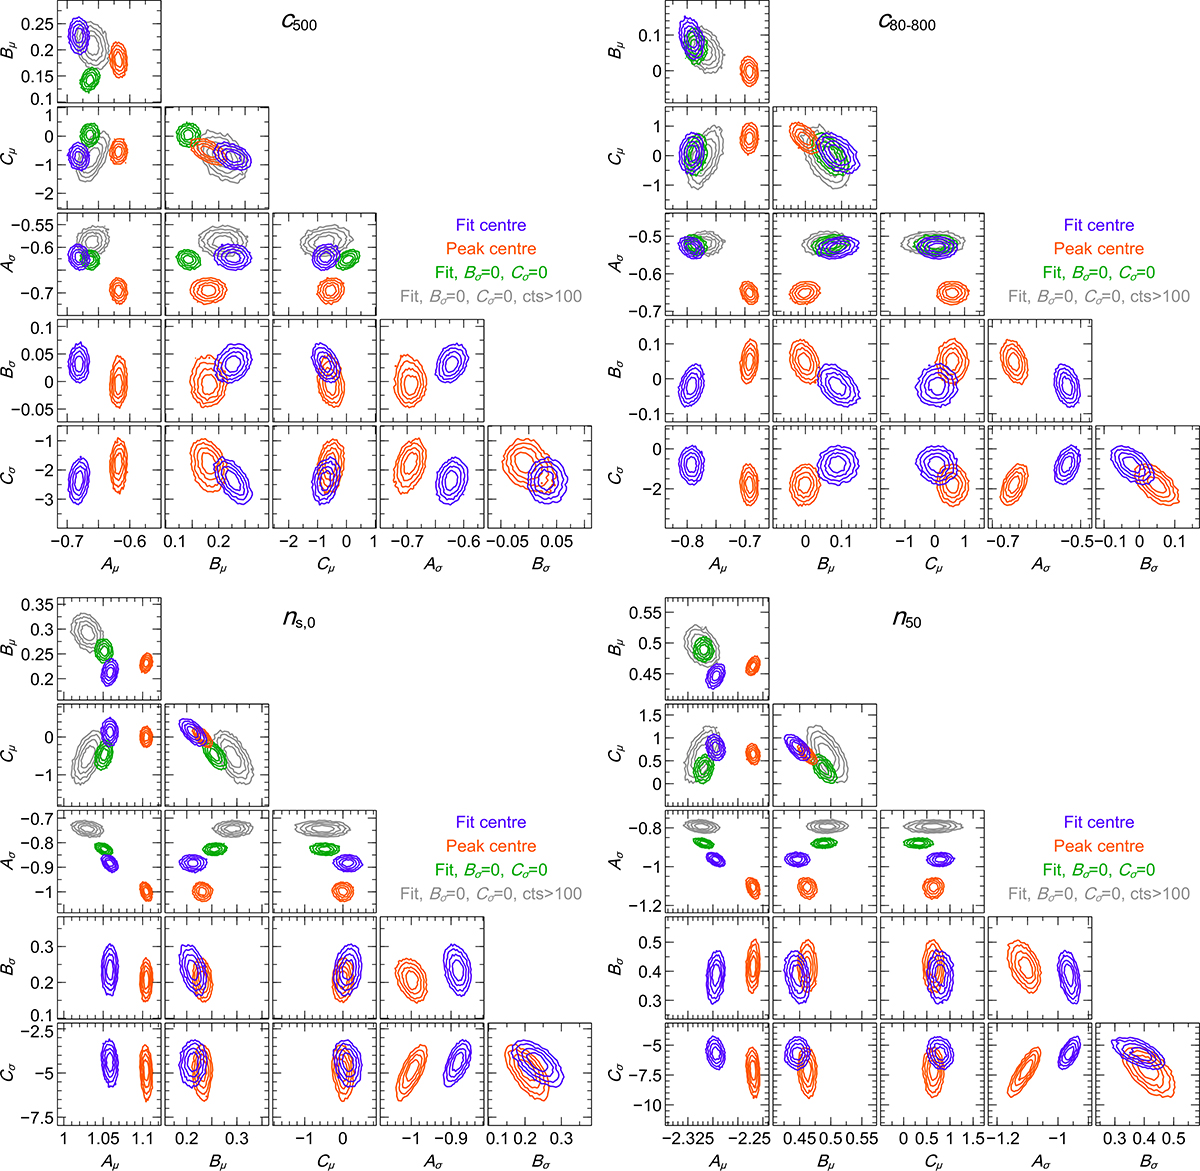
Fig. C.1.
Download original image
MCMC corner plots for the analysis of the scaling relation of concentration, c500 (top left) and c80 − 800 (top right), and density, ns, 0 (bottom left) and n50 (bottom right). The contours contain 39.3, 67.5, 86.4, and 95% of the samples. The contours are shown for the analysis with evolution in mean and width, where the centre positions of the clusters are fitted for, the same but using the peak cluster positions, a scaling relation with no evolution in width, with the fitted centres, and the same but only using clusters with more than 100 counts instead of 50 counts.
Current usage metrics show cumulative count of Article Views (full-text article views including HTML views, PDF and ePub downloads, according to the available data) and Abstracts Views on Vision4Press platform.
Data correspond to usage on the plateform after 2015. The current usage metrics is available 48-96 hours after online publication and is updated daily on week days.
Initial download of the metrics may take a while.