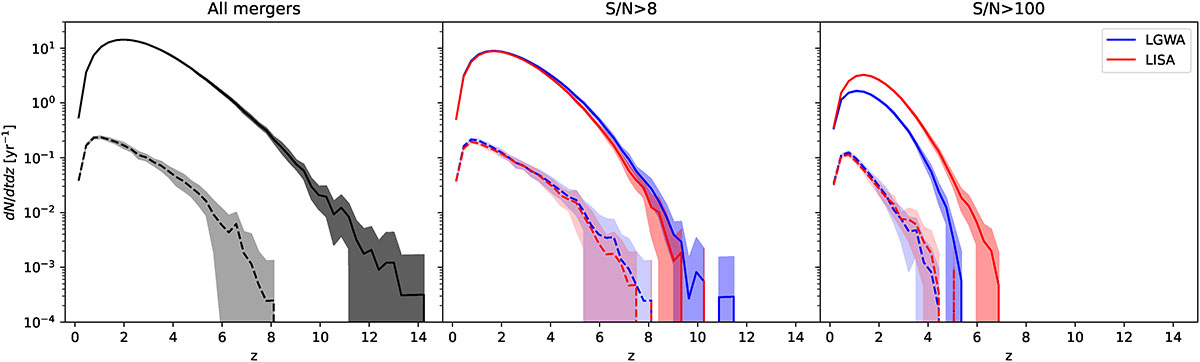
Fig. 10.
Download original image
Number of mergers per unit redshift per year at different redshifts, as detected by the two detectors for two cuts on the S/Ns. The time is reported in the observer frame. The lines show the average rates over 20 realisations, while the shaded region indicates the 1σ deviation from the mean. The solid lines and darker shaded region corresponds to the rates calculated using the lower limits on the DF, while the dashed lines and lighter shaded region corresponds to the upper limits. The left panel shows the rate for all mergers in our model, while the middle and right panels shows the rates for mergers detected by LGWA (blue) and LISA (red) with minimum S/Ns of 8 and 100, respectively.
Current usage metrics show cumulative count of Article Views (full-text article views including HTML views, PDF and ePub downloads, according to the available data) and Abstracts Views on Vision4Press platform.
Data correspond to usage on the plateform after 2015. The current usage metrics is available 48-96 hours after online publication and is updated daily on week days.
Initial download of the metrics may take a while.