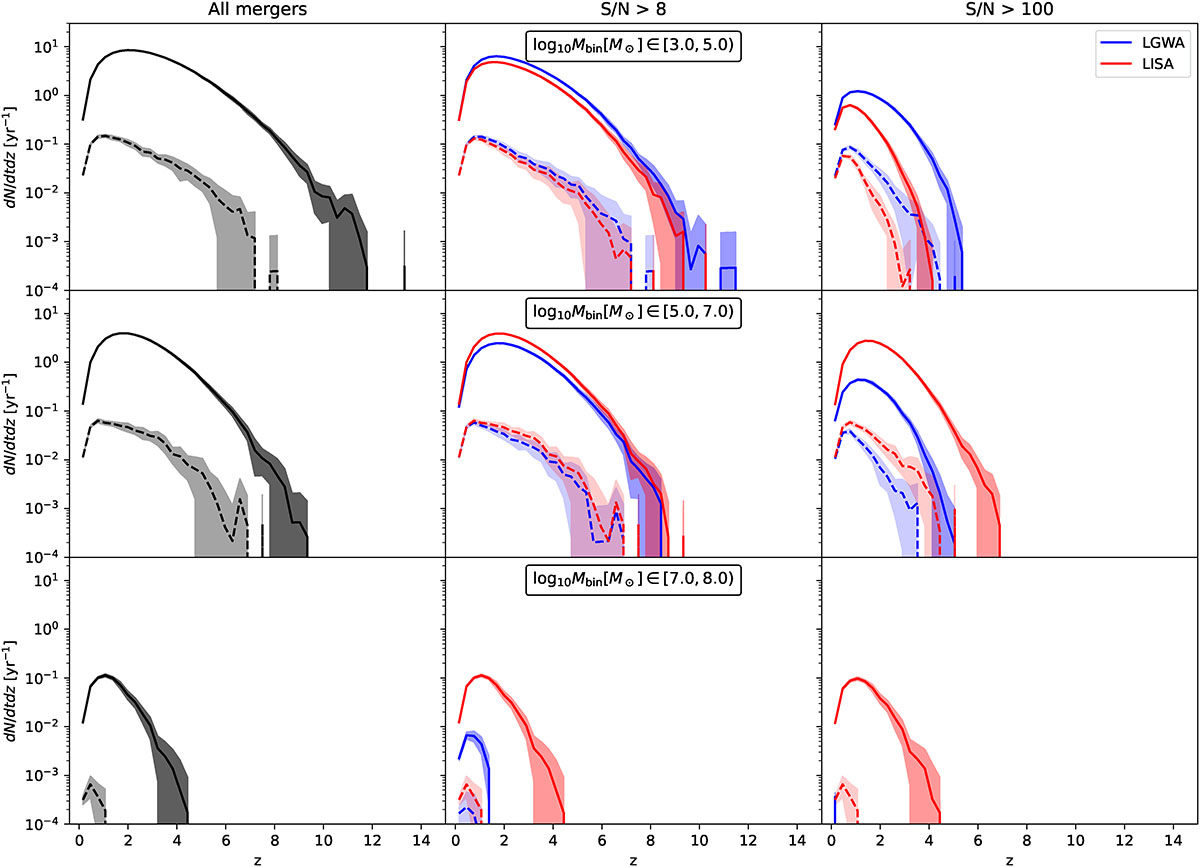
Fig. 11.
Download original image
Merger rate evolution in the observer frame for all binaries within mass ranges [103, 105] M⊙, [105, 107] M⊙, and [107, 108] M⊙. The first column shows the rate for all the mergers, while the remaining columns show the rate for events with S/N > 8 and 100 as seen by the detectors. The colour scheme is the same as in Figure 10.
Current usage metrics show cumulative count of Article Views (full-text article views including HTML views, PDF and ePub downloads, according to the available data) and Abstracts Views on Vision4Press platform.
Data correspond to usage on the plateform after 2015. The current usage metrics is available 48-96 hours after online publication and is updated daily on week days.
Initial download of the metrics may take a while.