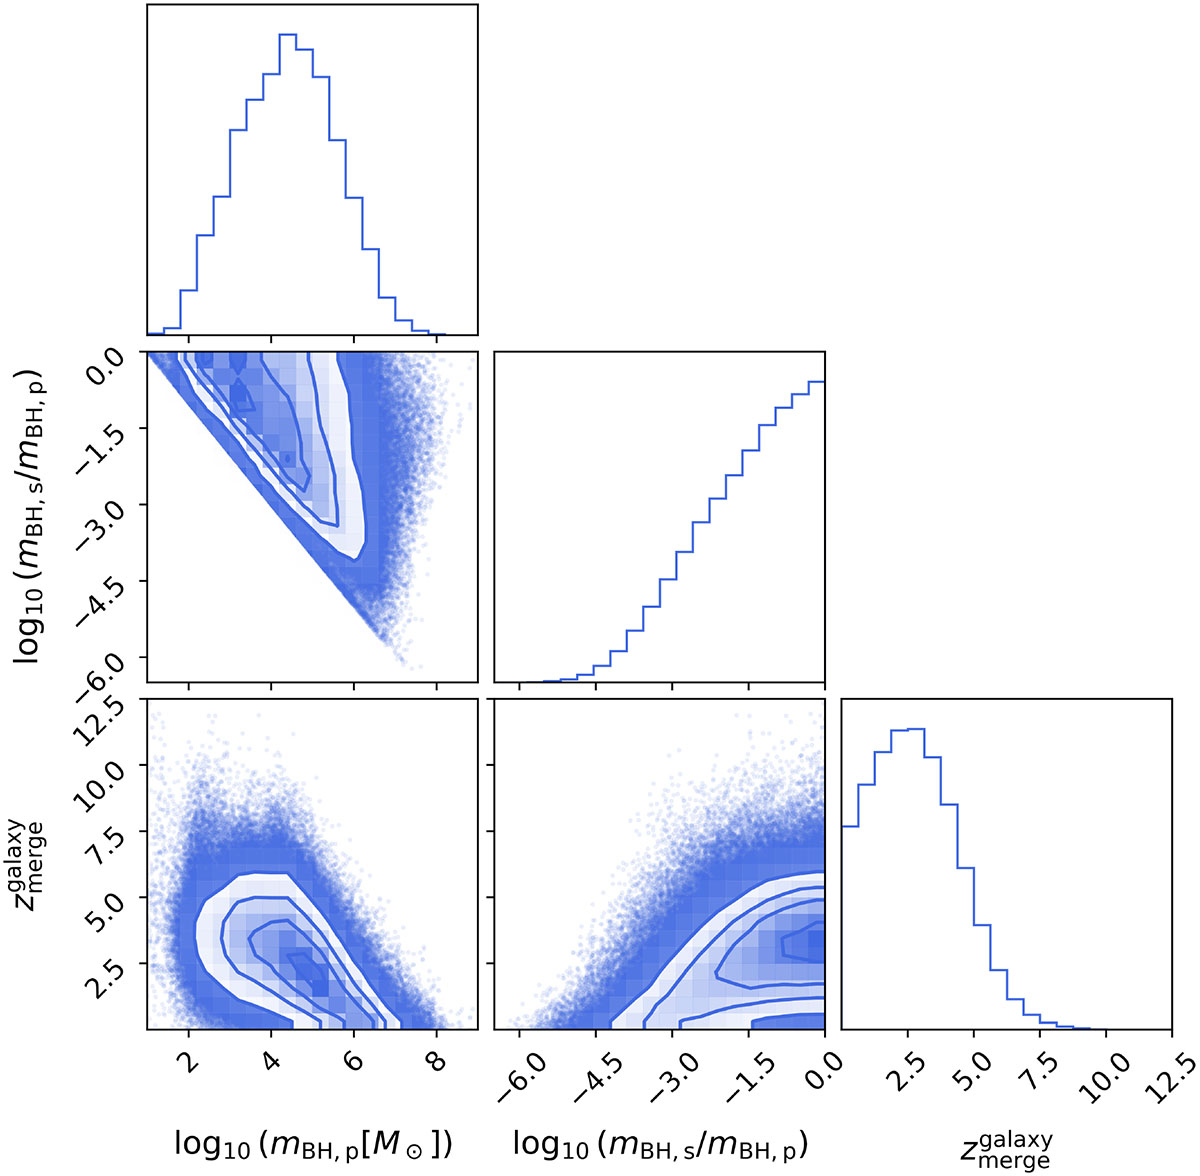
Fig. 4.
Download original image
Corner plot showing the distribution of the population of BH pairs formed after the galaxy merger. The plot shows the primary mass mBH, p, the secondary mass mBH, s divided by the primary BH mass mBH, s/mBH, p, and the redshift of the galaxy merger zmergegalaxy. The contours show the density of the points. Individual points outside the contours are also shown to visualize the extent of the distributions.
Current usage metrics show cumulative count of Article Views (full-text article views including HTML views, PDF and ePub downloads, according to the available data) and Abstracts Views on Vision4Press platform.
Data correspond to usage on the plateform after 2015. The current usage metrics is available 48-96 hours after online publication and is updated daily on week days.
Initial download of the metrics may take a while.