Fig. 10.
Download original image
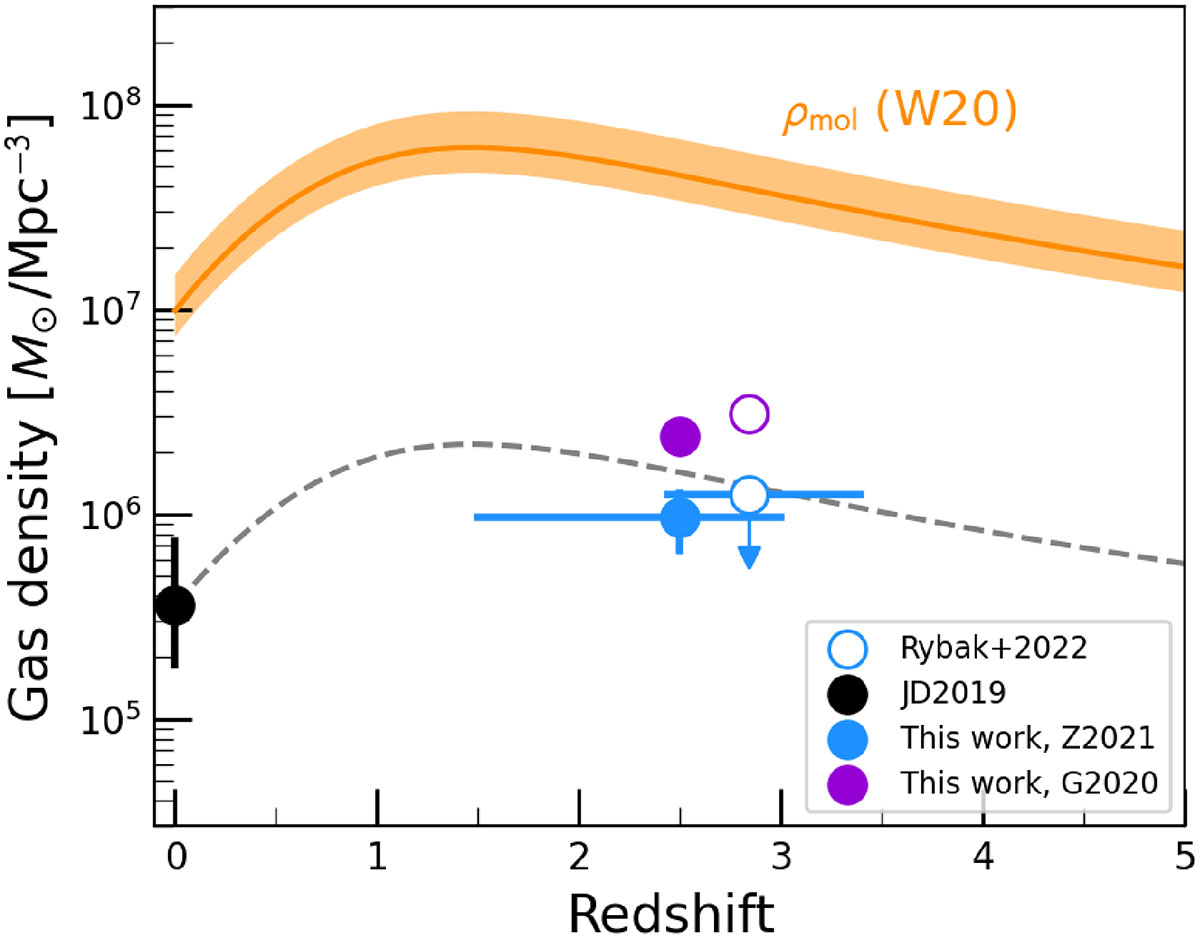
Redshift evolution of dense-gas mass density between the present-day (black point). The blue and purple points show dense-gas mass density inferred using the far-IR LFs from Zavala et al. (2021, blue) and Gruppioni et al. (2020, purple), respectively. The z ≈ 0 point (black) is inferred using HCN/FIR ratio from Jiménez-Donaire et al. (2019). We also show the upper limit from Rybak et al. (2022). Orange line points shows the evolution of total molecular gas density ρmol from Walter et al. (2020, orange solid line). Grey dashed line shows the Walter et al. (2020) trend normalised to match ρdense at z = 0. The ρdense evolution is consistent with the redshift evolution of ρmol with a constant dense-gas fraction of ≈3.5%.
Current usage metrics show cumulative count of Article Views (full-text article views including HTML views, PDF and ePub downloads, according to the available data) and Abstracts Views on Vision4Press platform.
Data correspond to usage on the plateform after 2015. The current usage metrics is available 48-96 hours after online publication and is updated daily on week days.
Initial download of the metrics may take a while.