| Issue |
A&A
Volume 706, February 2026
|
|
|---|---|---|
| Article Number | A69 | |
| Number of page(s) | 20 | |
| Section | Extragalactic astronomy | |
| DOI | https://doi.org/10.1051/0004-6361/202556845 | |
| Published online | 29 January 2026 | |
PRUSSIC
III. ALMA and NOEMA survey of dense gas in high-redshift star-forming galaxies
1
Leiden Observatory, Leiden University P.O. Box 9513 2300 RA Leiden, The Netherlands
2
Faculty of Electrical Engineering, Mathematics and Computer Science, Delft University of Technology Mekelweg 4 2628 CD Delft, The Netherlands
3
SRON – Netherlands Institute for Space Research Niels Bohrweg 4 2333 CA Leiden, The Netherlands
4
Institut für Astrophysik, Universität zu Köln Zülpicher Straße 77 D-50937 Köln, Germany
5
European Southern Observatory (ESO) Karl-Schwarzschild-Straße 2 Garching 85748, Germany
6
Cosmic Dawn Center (DAWN) København, Denmark
7
DTU–Space, Technical University of Denmark Elektrovej 327 2800 Kgs. Lyngby, Denmark
8
Department of Physics and Astronomy, University College London Gower Street London WC1E 6BT, United Kingdom
9
Transdisciplinary Research Area (TRA) Matter /Argelander-Institut für Astronomie, University of Bonn Bonn, Germany
10
Max–Planck Institut für Astronomie Königstuhl 17 69117 Heidelberg, Germany
11
Department of Space, Earth and Environment, Chalmers University of Technology SE-412 96 Gothenburg, Sweden
★ Corresponding author: This email address is being protected from spambots. You need JavaScript enabled to view it.
Received:
13
August
2025
Accepted:
4
November
2025
Abstract
Characterising the relationship between dense gas and star formation is critical for understanding the assembly of galaxies throughout cosmic history. However, due to the faintness of standard dense-gas tracers – HCN, HCO+, and HNC – dense gas in high-redshift galaxies remains largely unexplored. We present ALMA and NOEMA observations targeting HCN/HCO+/HNC (3–2) and (4–3) emission lines in 11 (mostly) gravitationally lensed dusty star-forming galaxies (DSFGs) at redshift z = 1.6 − 3.2. We detect at least one line in 10 out of 11 galaxies. Altogether, we detect 34 dense-gas transitions, more than quadrupling the number of extant high-redshift detections. Additionally, in two targets, we detect lower-abundance CO isotopologues 13CO and C18O, as well as CN emission. We derive excitation coefficients for HCN, HCO+, and HNC in DSFGs, finding them to be systematically higher than those in nearby luminous infrared galaxies. Assuming the canonical dense-mass conversion factor (αHCN = 10), we find that DSFGs have shorter dense-gas depletion times (median 23 Myr) than nearby galaxies (≈60 Myr), with a star-forming efficiency per free-fall time of 1−2%, a factor of a few higher than in local galaxies. We find a wide range of dense-gas fractions, with HCN/CO ratios ranging between 0.01 and 0.15. Finally, we put the first constraints on the redshift evolution of the cosmic dense-gas density, which increases by a factor of 7 ± 4 between z = 0 and z = 2.5, consistent with the evolution of the cosmic molecular-gas density.
Key words: ISM: molecules / galaxies: high-redshift / galaxies: ISM / galaxies: star formation / submillimeter: galaxies
© The Authors 2026
 Open Access article, published by EDP Sciences, under the terms of the Creative Commons Attribution License (https://creativecommons.org/licenses/by/4.0), which permits unrestricted use, distribution, and reproduction in any medium, provided the original work is properly cited.
This article is published in open access under the Subscribe to Open model. This email address is being protected from spambots. You need JavaScript enabled to view it. to support open access publication.
1. Introduction
Understanding the process of star formation – how the cold, molecular gas is converted into newborn stars – is one of the key questions in astrophysics. Present-day galaxies, on average, convert gas into stars inefficiently, depleting their gas over billions of years (e.g. Tacconi et al. 2018, 2020). However, in the early Universe, the star-forming activity was much higher, peaking between redshifts z = 1 − 4 (e.g. Madau & Dickinson 2014; Zavala et al. 2021; Harikane et al. 2023), during the so-called “Cosmic Noon”. This intense star formation is dominated by massive, dusty star-forming galaxies (DSFGs1), which were producing stars at rates up to a hundred times higher than present-day galaxies (e.g. Magnelli et al. 2011; Dudzevičiūtė et al. 2020; Zavala et al. 2021).
This trend is qualitatively matched by the evolution of molecular gas density, based on surveys of low-J CO, [C II], [C I], and cold dust emission, primarily with the NOrthern Extended Millimeter Array (NOEMA) and Atacama Large Millimeter/Sub-millimeter Array (ALMA) (e.g. Riechers et al. 2019; Walter et al. 2020; Hodge & da Cunha 2020; Tacconi et al. 2020; Bollo et al. 2025 and references therein). These studies have shown that the elevated star-forming activity at the Cosmic Noon is primarily due to the increase in the molecular gas content of galaxies, with only a mild increase in star-forming efficiency (by a factor of ≈3).
However, these large-volume average trends provide a potentially biased view of the actual star-forming processes in high-redshift galaxies. First, while conveniently bright, CO, [C II], [C I], and dust continuum trace gas across a wide range of densities (down to ≈100 cm−3 for [C II]), rather than the dense gas from which stars actually form (n ≥ 104 cm−3). Moreover, spatially resolved observations of [C II] (e.g. Gullberg et al. 2018; Rybak et al. 2019, 2020; Fujimoto et al. 2020; Ginolfi et al. 2020; Ikeda et al. 2025) and CO(1–0) emission (e.g. Ivison et al. 2011; Riechers et al. 2011; Stanley et al. 2023; Rybak et al. 2025) indicate that the majority of cold gas (up to ≈80%, Rybak et al. 2025) is in extended, diffuse halos and does not directly contribute to the observed star-forming activity. Finally, theoretical studies suggest that the bulk of cold, molecular gas might reside in low-mass, sub-mm faint galaxies, rather than high-mass, sub-mm bright galaxies that dominate the star-forming activity at the Cosmic Noon (e.g. Lagos et al. 2020).
To properly understand the star-forming processes in high-redshift galaxies, we need to characterise the relationship between their dense gas2 and star formation. Tracing dense gas requires observations of spectral lines of molecules that have high critical densities – particularly HCN, HCO+, and HNC, whose ground-state rotational transitions have critical densities of ncrit = 13 × 105, 1.9 × 10⁵, and 3 × 105 cm−3 at a temperature of T = 20 K, respectively.
Indeed, surveys of local galaxies have established HCN(1–0) as the ‘gold-standard’ tracer of dense gas (see, e.g. recent reviews by Saintonge & Catinella 2022; Schinnerer & Leroy 2024). The HCN(1–0) luminosity and star-formation rate correlate linearly over ∼8 orders of magnitude, from individual molecular clouds (e.g. Wu et al. 2005; Kauffmann et al. 2017; Dame & Lada 2023; Forbrich et al. 2023) to entire galaxies (e.g. Nguyen et al. 1992; Gao & Solomon 2004b; Graciá-Carpio et al. 2008; García-Burillo et al. 2012; Costagliola et al. 2011) and sub-galactic scales (e.g. Bigiel et al. 2015; Gallagher et al. 2018; Jiménez-Donaire et al. 2019; Neumann et al. 2023; Stuber et al. 2025). Compared to HCN, HCO+ and HNC are more sensitive to gas thermodynamics. For example, HCO+ is sensitive to the free-electron abundance (e.g. Papadopoulos 2007), while HNC abundance depends on gas temperature due to its temperature-sensitive formation and destruction pathways (e.g. Hacar et al. 2020).
Extending local studies of dense-gas tracers to high redshift remains challenging, as the HCN/HCO+/HNC emission can be more than 10× fainter than CO. Additionally, at high redshift, the ground-state HCN/HCO+/HNC lines move into the high-frequency bands of Karl G. Jansky Very Large Array (JVLA), which can be used only under good weather conditions. As a result, to date, “there have been no systematic studies of HCN (or other high-dipole-moment molecules) at high-z, but in principle these are now feasible with the capabilities of ALMA and NOEMA” (Tacconi et al. 2020, p. 168). In fact, despite almost two decades of effort, there are only three z ≥ 1 DSFGs detected in the HCN(1–0) emission3 (Gao et al. 2007; Oteo et al. 2017; Rybak et al. 2022). Indeed, as shown by the recent JVLA survey of Rybak et al. (2022), DSFGs might have low dense-gas fractions, making HCN(1–0) emission even harder to detect.
An alternative to observing the ground-state transitions are the mid-J rotational HCN/HCO+/HNC lines. These are both intrinsically brighter than the ground-state transitions and at z ≥ 1 fall conveniently into the easily accessible 2-mm and 3-mm atmospheric windows. The mid-J HCN lines have been proposed to be better tracers of dense gas than HCN(1–0) (Viti 2017), but their interpretation is more complex, as they might be sensitive to, e.g. shock heating, and mid-IR pumping (Aalto et al. 2007; Kazandjian et al. 2015).
In local galaxies, the HCN/HCO+/HNC (3–2) and (4–3) lines have been systematically targeted from the scales of entire galaxies (Baan et al. 2008; Bussmann et al. 2008; Graciá-Carpio et al. 2008; Krips et al. 2008; Zhang et al. 2014; Imanishi et al. 2018a; Israel 2023) to sub-kiloparsec scales (Wilson et al. 2008; Tan et al. 2018; Nishimura et al. 2024; Butterworth et al. 2025) and parsec scales (e.g. Imanishi et al. 2018b; Impellizzeri et al. 2019). In contrast, only a handful of z ≥ 1 DSFGs have been detected in the Jupp = 3, 4, and 5 emission lines (Danielson et al. 2013; Oteo et al. 2017; Béthermin et al. 2018; Cañameras et al. 2021; Yang et al. 2023), alongside several quasars (Wagg et al. 2005; Riechers et al. 2010). Even spectral stacking studies have yielded only a handful of HCN/HCO+(4–3) detections (Spilker et al. 2014; Reuter et al. 2023; Hagimoto et al. 2023). However, stacking studies only cover Jupp ≥ 3 lines and miss anchoring to low-J emission lines.
Converting these mid-J HCN detections to dense-gas masses requires knowing the HCN spectral line energy distribution. However, the excitation of dense-gas tracers is almost completely unconstrained. Even in local galaxies, HCN/HCO+/HNC ladders have been largely unexplored, with only a handful of studies dedicated to the topic (e.g. Krips et al. 2008; Papadopoulos et al. 2014; Israel 2023). At high redshift, just one DSFG has been detected in both the ground-state and a mid-J HCN transition: SDP.9 (z = 1.575), which was detected in HCN(1–0) and HCN(3–2) by Oteo et al. (2017). The stacking studies are not helpful in this regard, as they do not cover the ground-state transition. Moreover, different transitions – e.g. HCN(3–2) and (4–3) lines – arise from different galaxies, which can hide the true scatter of the excitation ratios (see a recent work on CO excitation by Frias Castillo et al. 2023).
PRUSSIC4 is a comprehensive census of dense-gas tracers in high-redshift star-forming galaxies, aiming to drastically expand the number of high-redshift galaxies detected in dense-gas tracers. In the first PRUSSIC paper, Rybak et al. (2022, Paper I) have presented the JVLA observations of the Jupp = 1 HCN, HCO+, and HNC emission in six z ∼ 3 lensed DSFGs, finding low dense-gas fractions and elevated dense-gas star-forming efficiencies. The second paper (Rybak et al. 2023, Paper II) presented ALMA imaging of the HCN, HCO+, and HNC Jupp = 4 lines in a z ≈ 3 lensed DSFG SDP.81, finding an unusually high HCO+/HCN ratio, indicating a subsolar metallicity and low mechanical heating.
In this third paper of the PRUSSIC series, we present observations of the mid-J HCN/HCO+/HNC emission in 11 redshift5z = 1.6 − 3.2 lensed star-forming galaxies, obtained with ALMA and NOEMA. This paper is structured as follows. In Section 2, we present the targeted galaxies, details of NOEMA and ALMA observations, and data reduction. Section 3 presents the resulting continuum (Sect. 3.1) and line measurements (Sect. 3.2). In Section 4, we place our observations in the context of low- and high-redshift surveys of dense gas (Sect. 4.1), discuss the HCN/HCO+/HNC line width (Sect. 4.2) and ratios (Sect. 4.3), present the dense-gas excitation ladders (Sect. 4.4), derive the star-forming efficiencies (Sect. 4.5), place constraints on the redshift evolution of the dense-gas content of galaxies (Sect. 4.6), and discuss the underlying systematics (Sect. 4.7).
2. Targets, observations, and imaging
2.1. Target sample
Our sample comprises eleven DSFGs at z = 1.6 − 3.1 (median z = 2.52), i.e. 2.1−4.1 Gyr after the Big Bang. The targets are drawn from the Herschel H-ATLAS survey (Negrello et al. 2010, 2017), and the Planck sample of strongly lensed DSFGs (Cañameras et al. 2015; Harrington et al. 2021).
The intrinsic (magnification-corrected) far-infrared luminosity spans almost 1 dex (LFIR = 2.5 × 10¹² − 2.2 × 10¹³ L⊙; median: 1.0 × 10¹³ L⊙), which corresponds to a star-formation rate SFR = 400−4000 M⊙ yr−1 (median SFR = 1800 M⊙ yr−1). The targeted DSFGs thus include both extremely star-forming systems, as well as more “normal” galaxies at these redshifts. We list the properties of individual galaxies in Table 1.
Target galaxies and their properties, ordered by increasing redshift.
Five galaxies from our sample were observed with NOEMA, while six additional sources were observed by ALMA. SDP.130 was observed by both NOEMA (Jupp = 3 lines) and ALMA (Jupp = 4 lines). Five galaxies (including SDP.130) were targeted in both Jupp = 3 and 4 transitions. Finally, for completeness, we also include ALMA observations of SDP.81, previously presented in Paper II.
2.2. NOEMA observations and calibration
The observations were carried out under the NOEMA projects S21CB and S23CB (PI: M. Rybak). In total, five sources were observed: SDP.9, SDP.11, J0209, J1202, and SDP.130. The S21CB observations were carried out between June 2021 and January 2022. The S23CB observations were carried out in October 2023. The array consisted of 9 to 12 antennas with 15 m diameter deployed in either D (the most compact) or C configuration. All observations were taken in the standard wideband mode, with two 7.744-GHz sidebands and spectral resolution of 2 MHz. As the observations spanned both summer and winter semesters, the precipitable water vapour (pwv) varied considerably between individual scheduling blocks, from ∼2 mm to ∼12 mm. Details of the NOEMA observations are given in Appendix A.
The NOEMA data were calibrated and reduced using the GILDAS package6. We used the new baseline-based amplitude calibration where applicable. Tracks for J0209 and SDP.130 showed some shadowing at low elevations; we manually flagged the shadowed antennas. Additionally, we tried to further improve the data fidelity by using self-calibration; however, this did not yield an appreciable increase in the signal-to-noise ratio (S/N). The data presented below are thus not self-calibrated. The resulting beam size FWHM varied from 2.6″ × 0.9″ to 7.5″ × 5.0″.
2.3. ALMA observations and calibration
We supplemented our NOEMA observations with archival ALMA data from project 2017.1.01694.S (PI: I. Oteo). This project targeted a total of eight lensed DSFGs discovered in Herschel surveys. Seven sources were targeted in the Jupp = 4 transitions, while G09v1.40 (which is at a lower redshift than the rest of the sample) was observed in the Jupp = 3 transitions. Data for SDP.81 have been recently presented in Rybak et al. (2023), here we present the remaining seven sources.
The observations were carried out between 2018 March 30 and 2018 May 1 using ALMA Band 3 receivers. The time on-source ranged between 0.5 and 1.7 hours. The baselines ranged between 15 and 500 m for all sources but NAv1.195, for which baselines out to 740 m were used. The spectral setup consisted of a single sideband with two spectral windows, each with 128 channels with a frequency resolution of 31.250 MHz. The other sideband was not used.
We processed the data using the standard ALMA pipeline; the data quality was generally excellent. The resulting beam size FWHM varied from 2.1″ × 1.6″ to 2.7″ × 2.1″.
2.4. Imaging procedure
We imaged the data using CASA’s tclean task. To maximise the sensitivity, we used natural weighting for all images. We used a pixel size of 0.1″ × 0.1″, ensuring that the synthesised beam is properly sub-sampled (see Table A.1).
For both NOEMA and ALMA data, we first identified potential line emission by examining dirty-image cubes. The resulting cubes had a default channel spacing of 20 MHz; in case these did not show any signal, we re-imaged the data using a coarser resolution of 100 MHz. We then created wide-band continuum images excluding channels with emission lines. For NOEMA, we created separate continuum images for the upper/lower sideband.
In the next step, we subtracted the continuum signal by fitting a constant function to the line-free channels using CASA’s uvcontsub task. We then extracted spectra for each source using hand-drawn apertures corresponding to the 2σ contour in continuum maps; these are presented in Fig. 1. Finally, we created narrow-band images of each line by imaging the channels within ±0.5 FWHM of the low-J CO line (Table 1). We performed the deconvolution manually, with a stopping threshold of 1.5σ.
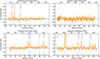 |
Fig. 1. NOEMA Band-1/2 spectra for J1202. We detect the HCN, HCO+, HNC (3–2) and (4–3) lines, alongside the CO(3–2) isotopologues and CN(3–2). The HNC(3–2) and (4–3) line profiles differ significantly from those of HCN and HCO+. See Appendix B for the spectra of remaining targets. |
To derive the line fluxes, we created narrow-band images over ±0.5 FWHM of the linewidth of the lowest-J CO line available (Fig. 2). For a Gaussian profile, this range should include 76% of the total line flux; we corrected the inferred total line luminosities accordingly. We preferred this approach to fitting parametric profiles to the spectra, as the lines might not follow exactly a Gaussian profile (see Section 4.2).
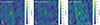 |
Fig. 2. NOEMA narrow-band images of the HCN/HCO+/HNC lines for SDP.9, which is detected in all three transitions. For the remaining sources, see Appendix B. Contours start at ±2σ and increase in steps of 2σ. |
3. Results
3.1. Continuum emission
We first examined the continuum images for individual sources (Figs. B.1 and B.2), which corresponds to rest-frame wavelengths 845 μm or 1.1 mm. All NOEMA targets are marginally resolved. In the ALMA imaging, G09v1.326 and NAv1.195 are resolved into two separate components; SDP.130 is marginally resolved, with a small extension to the south-west, which is arising from a source at a lower redshift (Falgarone et al. 2017). For the lensed sources, a significant fraction of the observed 2-mm or 3-mm continuum might arise from AGNs in the foreground lensing galaxies, such as seen in ALMA Band 3 observations of SDP.81 (Rybak et al. 2023).
3.2. HCN, HCO+, and HNC emission
Figure 2 shows the narrow-band images at the positions of HCN, HCO+, and HNC lines. We detect HCN/HCO+/HNC (3−2) emission lines in all targeted galaxies except SDP.130, and HCN/HCO+/HNC (4−3) emission lines in seven out of nine targets. The two sources without any line detections are G09v1.326 and G15v2.235. Additionally, J1202 is not detected in the HNC(4–3) line, while SDP.130 is not detected in the HCO+(4–3) line (Rybak et al. 2023). The inferred line luminosities (or 3σ upper limits) are listed in Table 2. We provide details on the detections of CO isotopologues and CN(3–2) lines in Appendices C and D.
Rest-frame frequencies and luminosities (in units of 108 K km s−1 pc2) for HCN, HCO+, and HNC lines in individual galaxies.
4. Discussion
4.1. Dense-gas tracer scaling relations
We now compare our HCN, HCO+, and HNC observations to previous observations of local and high-redshift galaxies. Figure 3 presents our data in the context of z = 0 resolved (Tan et al. 2018; Li et al. 2020) and galaxy-averaged measurements (Greve et al. 2009; Krips et al. 2008; Greve et al. 2009; Papadopoulos et al. 2014; Zhang et al. 2014; Nishimura et al. 2024). Additionally, we compare our observations to the empirical power-law scaling relations of Nishimura et al. (2024) and Zhang et al. (2014).
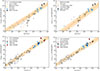 |
Fig. 3. Correlation between far-IR luminosity and HCN/HCO+(3–2) and (4–3) luminosities. Solid/dashed orange lines indicate the empirical trends from this work and Zhang et al. (2014) with ±1σ scatter; dotted orange lines indicate the empirical trend from Nishimura et al. (2024). Individual data points show z = 0 galaxy-averaged (Greve et al. 2009; Papadopoulos et al. 2014; Zhang et al. 2014; Nishimura et al. 2024) and resolved observations (Tan et al. 2018), and high-z detections in individual galaxies (Riechers et al. 2011; Cañameras et al. 2021, black, solid) and this work (blue). We also show results from spectral stacks (Reuter et al. 2023; Hagimoto et al. 2023). Where appropriate, we corrected for the lensing magnification. We also plot error bars on high-z measurements; these are typically smaller than the symbol size. |
However, the Nishimura et al. (2024) relations were derived over a narrow range of LFIR = (1 − 15)×1011 L⊙ and do not provide a good fit to data at higher and lower FIR luminosities. We therefore re-fit7 the HCN(3–2) and HCO+(3–2) data using a power-law model, fitting data from Krips et al. (2008), Li et al. (2020), Nishimura et al. (2024) and our high-z measurements. We obtain:
 (1)
(1)
and
 (2)
(2)
The slopes for HCN(3–2) and HCO+(3–2) are close to unity (within 1−2σ). The almost-linear slopes contrast with predictions for sub-linear correlation from older theoretical work (Krumholz & Thompson 2007; Narayanan et al. 2008) and surveys of local galaxies (e.g. Bussmann et al. 2008; Juneau et al. 2009, who found slopes of ≈0.7 for the log(LFIR)–log (L′HCN(3 − 2))’ Juneau et al. 2009).
For the Jupp = 4 lines, we consider the Zhang et al. (2014) relations8, which were derived using spatially unresolved observations of nearby galaxies:
 (3)
(3)
and:
 (4)
(4)
As is shown in Fig. 3, all our measurements are consistent with the Zhang et al. (2014)LFIR–HCN(4–3) trend within the ±1σ, similar to the single detection from Cañameras et al. (2021) and stacking results from Reuter et al. (2023). Similar to the HCN/HCO+(3–2) lines, the linear slopes inferred from the data contrast with predictions from Narayanan et al. (2008) who predicted a slope of ≈0.6.
While the HCN(4–3) luminosities in our DSFGs scatter equally above and below the Zhang et al. (2014) trend, they are slightly overluminous in HCO+(4–3), although still within the 1σ scatter. We provide a more detailed discussion of line ratios in Fig. 4. We do not show the corresponding plots for the HNC lines due to the paucity of z ≈ 0 measurements.
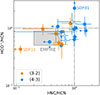 |
Fig. 4. HCO+/HCN and HNC/CO luminosity ratios in our sample (solid circles). We also include data from Yang et al. (2023) for comparison (empty squares). The shaded regions indicate HCO+/HCN and HNC/HNC ratios for the EMPIRE sample (Jiménez-Donaire et al. 2019). HCN is the brightest line in most of our targets. SDP.81 shows strong HCO+ enhancement, potentially due to low metallicity (Rybak et al. 2023). The HCN(3–2) emission line in SDP.11 is unusually bright, potentially due to AGN-driven chemistry. |
4.2. Linewidths of dense-gas tracers vs CO
We now investigate whether linewidths of dense-gas tracers differ significantly from those of low-J CO lines, which trace the bulk of molecular gas. Specifically, we fit a one-dimensional Gaussian profile to the slices of spectra within ±1000 km/s of the HCN, HCO+, and HNC lines. Although some lines show more complex profiles (e.g. HNC(4–3) line in J1202, Fig. B.5), a one-dimensional Gaussian profile allows a direct comparison to the low-J CO linewidths reported in the literature. The measured linewidths are listed in Table 3.
HCN, HCO+, and HNC FWHM linewidths for individual sources, inferred from one-dimensional Gaussian fits to the observed (i.e. not de-lensed) spectra.
Figure 5 compares the linewidths of HCN(3–2)/(4–3) and CO(1–0) lines. For J1202, we fit both the (3–2) and (4–3) lines; the HCN and HCO+ linewidths are consistent, but HNC(4–3) is significantly narrower than HNC(3–2).
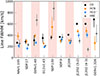 |
Fig. 5. Comparison of CO, HCN, HCO+, and HNC linewidths in individual galaxies, ordered by increasing CO linewidth. The linewidths of different tracers are generally consistent within 1σ uncertainties. Note the large discrepancies between HCN/HCO+ and HNC linewidths in G04v1.40 and J1202. |
On average, we find that the linewidths of dense-gas tracers are consistent with those of CO(1−0) emission. Namely, the mean linewidth (FWHM) ratios are as follows: HCN/CO: 0.95 ± 0.20; HCO+/CO: 0.70 ± 0.13; HNC/CO: 1.00 ± 0.27. However, several sources – particularly G09v1.40 and J1202 – show significant differences between different lines; we discuss them in detail in Section 4.7.1.
4.3. HCN, HCO+, and HNC line ratios
The ratios of HCN, HCO+, and HNC line luminosities provide insights into the thermodynamics and energetics of high-density gas. In particular, HCN/HCO+ enhancements have been proposed as an AGN signature (e.g. Kohno 2003; Graciá-Carpio et al. 2006; Krips et al. 2008; Privon et al. 2015; Izumi et al. 2016). However, as demonstrated by Viti (2017) and Privon et al. (2020), the HCN enhancements show rapid time evolution (on ≈1-Myr timescales) which decouples them from the AGN activity. Moreover, recent studies of nearby galaxies indicate that HCN/HCO+ can be only used as a reliable AGN diagnostic at scales of ≤100 pc (Butterworth et al. 2025).
As is shown in Fig. 4, the HCO+/HCN ratios in our sample are consistent with ≥1 with the exception of G12v2.43 and SDP.81. The elevated HCO+ luminosity in these sources might be due to sub-solar metallicity or time-evolution effects (Rybak et al. 2023).
The HNC/HCN ratio has been proposed to be a sensitive diagnostic of the gas temperature. Specifically, while HCN and HNC form via the same pathways with a branching ratio of ≈1:1, their relative abundances are modified via the HNC + H → HCN + N reaction and HNC + O → NH + CO reations, with ΔT ≈ 200 K (e.g. Graninger et al. 2014; Jin et al. 2015; Hacar et al. 2020). As a result, the HNC/HCN ratio is predicted to decrease with increasing gas kinetic temperature (e.g. Hacar et al. 2020).
We find HNC/HCN ≤1 in all sources except G12v2.43 (HNC/HCN = 1.4 ± 0.2). Compared to the EMPIRE sample, our DSFGs have comparable HCO+/HCN ratios, but have elevated HNC/HCN ratios. Using the Hacar et al. (2020) calibration Tkin = 10 × [IHCN/IHNC], we find kinetic temperatures of 10−35 K, similar to those in the Orion Nuclear Cluster (Hacar et al. 2020).
4.4. Dense-gas tracer excitation
Measuring the HCN/HCO+/HNC spectral line energy distribution (SLED) in DSFGs is necessary for a proper comparison of observations of different rotational transitions.
We observed four galaxies in multiple HCN transitions – J0209, J1202, SDP.9, and SDP.130. To anchor our SLEDs, we use ground-state observations from Oteo et al. (2017, SDP.9), Rybak et al. (2022, J1202, SDP.130) and Riechers et al. (in prep. J0209). For J0209, we include source-integrated HCN/HCO+/HNC(4–3) fluxes from high-resolution ALMA observations (N. Geesink, MSc thesis 2025). Figure 6 shows the dense-gas SLEDs for our sample, compared to the HCN SLEDs in z ∼ 0 galaxies from Israel (2023). While most SLEDs are consistent with being sub-thermalised (rj1 ≤ 1), J0209 and J1202 show superthermal ratios. This might be a result of non-thermal excitation by X-rays (e.g. Meijerink et al. 2007; Viti 2017; Privon et al. 2020) or infrared pumping (e.g. Sakamoto et al. 2010; Rangwala et al. 2011; Martín et al. 2021), or optical depth effects (e.g. if the ground-state transition has lower optical depth than the upper-state ones).
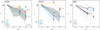 |
Fig. 6. Excitation coefficients of HCN, HCO+, and HNC in DSFGs from our sample (coloured), normalised to the (1−0) transition and compared to z ∼ 0 galaxies from the Israel (2023) compilation (grey). The arrows indicate the 3σ upper/lower limits. For comparison, we highlight SLEDs for nearby (U)LIRGs NGC 253, NGC 1068, and NGC 6946. In J0209 and J1202, the HCN and HCO+ SLEDs appear to be superthermalised. The sparseness of the HNC plot reflects the lack of detections at z ≈ 0. |
Combining the detections and upper limits on rj1 in our sample, we calculated the mean excitation ratios r31 and r41, assuming all high-z DSFGs share a common rj1. The inferred mean rj1 are listed in Table 4.
The inferred median rj1 are systematically higher than in most z ∼ 0 (ultra)luminous infrared galaxies (ULIRGS) from Israel (2023) (median r31 = 0.33 ± 0.18, r41 = 0.19 ± 0.15), although the low-redshift and high-redshift values are consistent within 1σ. However, some local sources have HCN excitation similar to (e.g. NGC 1068) or even higher (e.g. NGC 253, NGC 6240) than our high-redshift targets.
Finally, we tested whether rj1 excitation ratio depends on the FIR luminosity, combining our data with observations of nearby galaxies (Li et al. 2020; Israel 2023). We find that the data is consistent with a null hypothesis of a constant rj1. The lack of correlation of HCN excitation with LFIR mirrors the results of Li et al. (2020), who report no significant correlation of HCN(3–2)/HCN(1–0) luminosity with LFIR over LFIR = 108 − 1012 L⊙.
In this analysis, we remain agnostic about the physical mechanism driving the dense-gas excitation (e.g. heating by turbulence, cosmic rays or X-rays; mid-infrared pumping); our objective was simply to derive the median excitation coefficients to obtain the HCN(1–0) luminosities. We will explore dense-gas thermodynamics in future work.
4.5. Star-forming efficiencies and dense-gas fractions in DSFGs
Armed with the constraints on the HCN excitation, we assessed the dense-gas star-forming efficiency SFEdense = Mdense/SFR and dense-gas fractions for our sample. We first calculated SFEdense, assuming it is directly proportional to the ratio of HCN(1–0) luminosity and obscured star formation, SFR = 1.71 × 10⁻¹⁰ × LFIR for the Salpeter stellar initial mass function.
We derived the dense-gas mass Mdense for each galaxy as:
 (5)
(5)
where and αHCN is the conversion factor between HCN(1–0) luminosity and the dense-gas mass.
Specifically, we corrected our HCN(4–3) and HCN(3–2) observations using r41 and r31 factors derived in Section 4.4. For galaxies where both HCN(3–2) and HCN(4–3) are detected, we list values inferred from the lower-J line. For αHCN, we assumed the canonical value of 10 M⊙(K km s−1)−1 (Gao & Solomon 2004b); see Section 4.7 for a more detailed discussion of this choice.
As is shown in Fig. 7, almost all of our data points fall below the mean HCN(1–0)/FIR trend in nearby galaxies from Jiménez-Donaire et al. (2019): HCN(1–0)/FIR = 10−3, with a 1σ spread of 0.37 dex. Our sample has a median HCN(1–0)/FIR ratio of  , approximately 1σ below the median for nearby galaxies (
 , Jiménez-Donaire et al. 2019). The joint probability of our HCN/FIR ratios being consistent with the Jiménez-Donaire et al. (2019) value is p ≈ 10−3; i.e. DSFGs as a population have significantly lower HCN/FIR ratios. As there are no z ≈ 0 galaxies with FIR luminosities comparable to our sample, we cannot determine whether this turnover in HCN/FIR ratio (i.e. a deviation from a linear HCN–FIR correlation) is related to the higher redshift or a higher FIR luminosity of DSFGs. Turnover in HCN/FIR in intensely star-forming galaxies was predicted by theoretical models of Krumholz & Thompson (2007), where it is a consequence of median density exceeding the critical density for HCN emission.
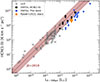 |
Fig. 7. HCN(1–0) vs FIR luminosity (8−1000 μm) for our sample (blue), compared to other high-redshift (black) and selected low-redshift (grey) measurements for entire galaxies (Gao & Solomon 2004a; Graciá-Carpio et al. 2008; Krips et al. 2008; García-Burillo et al. 2012; Privon et al. 2015), and the empirical linear trend from Jiménez-Donaire et al. (2019, red). Our measurements fall systematically below the linear HCN-FIR correlation. |
Figure 8 shows the inferred HCN(1–0)/FIR (a proxy for dense-gas depletion time, τdense = Mdense/SFR) and HCN(1–0)/CO(1–0) (a proxy fdense). For z = 0 galaxies, we plot the galaxy-integrated observations of Gao & Solomon (2004a), Graciá-Carpio et al. (2008), Krips et al. (2008), García-Burillo et al. (2012), Privon et al. (2015).
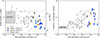 |
Fig. 8. Left: Ratio of HCN(1–0) and FIR luminosities (a proxy for star-forming efficiency) as a function of star-formation rate. The dotted lines indicate the mean and 1σ scatter for local galaxies from the EMPIRE sample (Jiménez-Donaire et al. 2019). We infer HCN(1–0) luminosities for our DSFGs using the following excitation coefficients: r31 = 0.41 and r41 = 0.59. Right: Ratio of HCN(1–0) and CO(1–0) luminosities (a proxy for the dense-gas fraction). The inferred HCN/CO ratios span ≈1 dex, suggesting that dense-gas fraction in high-z DSFGs vary significantly source-to-source. |
The HCN(1–0)/CO(1–0) luminosity ratios range between 0.01 (SDP.9) and 0.36 (SDP.11), with a median of  ; about half of our sample has HCN/CO ≤ 0.05. While the HCN/CO ratios can be affected by differential magnification (Section 4.7.2), the wide spread of values likely refers real physical differences between individual sources. We did not find a significant correlation between HCN/FIR and HCN/CO.
Assuming that αHCN does not change between z = 0 and z = 2.5, this implies a significantly elevated SFEdense. We estimated the dense-gas and total molecular gas mass – and the corresponding depletion timescales – using conversion factors αHCN = 10 and αCO = 1 (Table 5). Our choice of αCO = 1 was motivated by kinematic constraints on gas masses in DSFGs (e.g. Calistro Rivera et al. 2018; Frias Castillo et al. 2022; Amvrosiadis et al. 2025), although higher values have been proposed for some systems (e.g. Dunne et al. 2022; Harrington et al. 2021).
Dense-gas masses, fractions, and dense-gas and molecular-gas depletion timescales for individual galaxies.
We find a median dense-gas fraction  and a median dense-gas depletion timescale of
  Myr. This is significantly shorter than the typical τdense ≃ 60 Myr in nearby spiral galaxies from the EMPIRE survey (Jiménez-Donaire et al. 2019). The increase in SFE would be further reinforced if DSFGs have lower αHCN than z ≈ 0 spiral galaxies (e.g. Graciá-Carpio et al. 2008; Jones et al. 2023; Vollmer et al. 2025; see Section 4.7.3 for more detail).
How do dense-gas depletion timescales compare to the depletion timescales for the total molecular gas? Figure 9 compares the depletion times for the total molecular gas (traced by CO) and dense gas (traced by HCN). Assuming αCO = 1 M⊙(K km s−1 pc2)−1, the molecular gas depletion times τmol range between 11 Myr (G12v2.43) and 110 Myr (SDP.9). The dense-gas depletion timescales τdense range between 10 and 30 Myr, with a mean of 18 ± 5 Myr. In almost all cases, τdense is systematically lower than τmol. This discrepancy would increase further for αCO ≥ 1 or αHCN ≤ 10 M⊙(K km s−1 pc2)−1. In case of G12v2.43 and SDP.11, τdense ≥ τmol, which is clearly unphysical. This is a clear indication that our assumption on αCO = 1 and αHCN = 10 are not applicable to all DSFGs.
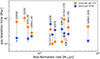 |
Fig. 9. Depletion timescales for the total molecular gas τmol (orange, based on CO(1–0)) and dense gas τdense (blue, based on HCN) for individual DSFGs from our sample. The gas masses are derived using αCO = 1 and αHCN = 10. In several galaxies, τdense ≥ τmol; this indicates that αCO and/or αHCN deviate from the assumed values. The median dense-gas depletion timescale is 24 Myr. |
We can get additional insights into the process of star-formation by considering the star-forming efficiency per free-fall time (e.g. Krumholz & McKee 2005). The free-fall timescale of a self-gravitating cloud with a density ρ is  , where G is the gravitational constant and ρ the mean gas density, ρ = mun. Setting n = 3 × 104 cm−3, we obtain tff = 0.25 Myr which is comparable to the expected formation timescale for O-type stars (≈0.5 Myr, e.g. Sabatini et al. 2021). The corresponding dense-gas star-forming efficiency per free-fall time ϵff = tdep/tff (Krumholz & McKee 2005) is then 1.3 ± 0.4%, compared to ≈0.4% for nearby galaxies (Jiménez-Donaire et al. 2019; Salim et al. 2020). The higher value of ϵff in DSFGs is comparable with estimates for present-day (U)LIRGs (1.4%, Usero et al. 2015).
In reality, dense cores have a complex three-dimensional geometry and will be subject to various internal processes. For a more realistic comparison, we use the results of hydrodynamical simulations of individual star-forming clouds by Onus et al. (2018). Using chemical and radiative transfer modelling, and allowing for an environment-dependent αHCN, Onus et al. (2018) derived an empirical scaling relation between the FIR/HCN(1–0) luminosity:
 (6)
(6)
which yields ϵff = 2.3 ± 0.6%, similar to 1.3 ± 0.4% derived for a self-gravitating cloud.
4.6. Redshift evolution of dense-gas mass density
We now use our high-redshift observations to estimate the evolution of dense-gas mass density ρdense, between the redshift range probed by our sample (z = 1.5 − 3.2) and the present-day. This “Madau-Dickinson” plot complements the evolution of the cosmic star-formation density (e.g. Madau & Dickinson 2014) and molecular gas density (e.g. Riechers et al. 2019; Tacconi et al. 2020; Walter et al. 2020). Such trends can serve as a powerful benchmark for the latest cosmological simulations that now directly include cold, dense gas (e.g. COLIBRE, Schaye et al. 2025).
We make the following assumptions:
-
(i)
HCN(1–0) luminosity is directly proportional to the dense-gas mass, Mdense = αHCN × L′HCN(1 − 0).
-
(ii)
A universal αHCN that does not depend on galaxy properties or redshift.
-
(iii)
The HCN excitation (rj1) does not depend on galaxy properties, but varies with redshift.
-
(iv)
The L′HCN(1 − 0)/LFIR ratio (i.e. dense-gas star-forming efficiency) varies with redshift, but not with galaxy properties.
The cosmic dense-gas mass density then can be expressed as:
 (7)
(7)
The assumptions above are, by necessity, simplifying. However, there is a strong case for a redshift evolution of dense-gas excitation and dense-gas star-forming efficiency. This is because the morphology and properties of “typical” star-forming galaxies, as well as (U)LIRGS, change dramatically between present day and the Cosmic Noon.
First, high-redshift galaxies have both higher star-formation rates and star-forming efficiency, even at the same stellar mass as z ≈ 0 ones (e.g. Tacconi et al. 2020). Second, high-redshift DSFGs are morphologically distinct from present-day ULIRGs with comparable LFIR: while star formation in ULIRGs is typically concentrated into a very compact region (just a few hundred parsecs across, e.g. Lutz et al. 2016; Barcos-Muñoz et al. 2017), in high-redshift galaxies, it is spread over a region few kiloparsecs across (e.g. Hodge et al. 2016; Gullberg et al. 2019). Third, DSFGs have significantly higher gas densities, far-UV irradiation (e.g. Wardlow et al. 2017; Rybak et al. 2019), and are potentially more turbulent (e.g. Dessauges-Zavadsky et al. 2019; Harrington et al. 2021). Finally, as we will discuss in Appendix C, high-redshift DSFGs might have a top-heavy stellar IMF. We discuss the potential impact of all these factors below.
We match our galaxies to the far-infrared luminosity functions (FIR LFs), rather than the stellar mass functions9. As our fiducial model, we adopt FIR LFs derived by Casey et al. (2018) and Zavala et al. (2021). For comparison, we repeat our calculations using FIR LFs of Gruppioni et al. (2013) for z = 0 and Gruppioni et al. (2020) for high redshift; while the latter overpredicts the star-formation rate density at z ≥ 4 (e.g. Zavala et al. 2021; van der Vlugt et al. 2022), it still provides a good fit to the observational data over the redshift range considered here.
Figure 10 shows the resulting constraints on the redshift evolution of ρdense. For the Casey et al. (2018) and Zavala et al. (2021) LFs, ρdense increases from  Mpc−3 at z = 0 to (9.6 ± 3)×106 M⊙ Mpc−3 at z = 2.5. This corresponds to an increase by factor of ≈3, but the z = 0 and z = 2.5 values are essentially consistent within 1.3σ, due to the considerable uncertainties on both measurements. For the Gruppioni et al. LFs, ρdense increases from
  Mpc−3 at z = 0 to (24 ± 8)×105 M⊙ Mpc−3 at z = 2.5. This translates to an increase by a factor of ≈7 (1.8σ significance). In summary, we see a tentative increase in ρdense towards high redshift.
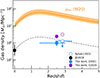 |
Fig. 10. Redshift evolution of dense-gas mass density between the present-day (black point). The blue and purple points show dense-gas mass density inferred using the far-IR LFs from Zavala et al. (2021, blue) and Gruppioni et al. (2020, purple), respectively. The z ≈ 0 point (black) is inferred using HCN/FIR ratio from Jiménez-Donaire et al. (2019). We also show the upper limit from Rybak et al. (2022). Orange line points shows the evolution of total molecular gas density ρmol from Walter et al. (2020, orange solid line). Grey dashed line shows the Walter et al. (2020) trend normalised to match ρdense at z = 0. The ρdense evolution is consistent with the redshift evolution of ρmol with a constant dense-gas fraction of ≈3.5%. |
We complement our constraint on ρdense at z = 2.5 by the upper limit on HCN/FIR ratio from Rybak et al. (2022) (≥3.6 × 10⁻⁴), which was derived directly from HCN(1–0) observations and is not affected by uncertainties on rj1. The Rybak et al. (2022) upper limit puts a nominally stronger constraint on ρdense at z = 2.5 − 3.5 (increase by a factor of ≤3.0 compared to z = 0), but is derived from a smaller sample of galaxies.
The tentative increase in ρdense is qualitatively in line with the higher molecular gas mass density ρmol at high redshift (e.g. Tacconi et al. 2020; Walter et al. 2020). For a more quantitative comparison, Fig. 10 shows the constraints on the total molecular gas mass from the Walter et al. (2020) compilation (orange), and the Walter et al., trend normalised to ρdense at z = 0 (grey line). Our constraints on the redshift evolution of dense gas are consistent with the ρmol trend, with a mean dense-gas fraction of ≈3.5%. This fraction is considerably lower than the dense-gas fractions derived for individual DSFGs (Table 5); however, the latter might suffer from a considerable uncertainty due to conversion factors or differential magnification. The constant dense-gas fraction indicate that the increase of SFR density at high redshift is driven by enhanced star-forming efficiencies rather than increased availability of dense gas – a direct.
4.7. Systematic uncertainties
4.7.1. Spatial offsets and differences in line profiles
Throughout this study, given the low angular (and spectral) resolution of our data, we assume that HCN, HCO+, and HNC emission trace the same gas. We now examine this assumption by looking for: (1) differences between the HCN/HCO+/HNC line profiles; (2) spatial offsets in moment-0 maps.
As is shown in Fig. 5, line profiles – parametrised by their Gaussian FWHM – are generally consistent within 2σ uncertainties. A similar correspondence was found for Jupp = 4, 5 lines in three galaxies high-z by Cañameras et al. (2021). However, noticeable differences are seen in several sources with high S/N: G09v1.40, J0209, and J1202. First, in G09v1.40, the HNC(3–2) line appears to be double-peaked, with a prominent blueshifted emission offset by 350 ± 50 km/s from the systemic redshift. In contrast, the HCN(3–2) and HCO+(3–2) lines are consistent with a Gaussian profile. We note that G09v1.40 has a massive molecular outflow, detected in the CH+ (Falgarone et al. 2017) and OH+ emission with an outflow velocity of ≈250 km/s (Butler et al. 2021). The HNC emission might be associated with this molecular outflow.
In J0209, the HCN, HCO+, and HNC lines have comparable linewidths, but are systematically (≈30%) narrower than the CO emission. This is consistent with a picture where the bulk of low-J CO emission arises from extended gas reservoir (e.g. König et al. 2018; Rybak et al. 2025), as has been confirmed by high-resolution ALMA observations (N. Geesink, MSc thesis).
Finally, in J1202, the HNC(3–2) and HCN(4–3) are significantly narrower than the corresponding HCN and HCO+ transitions. Compared to the HCN and HCO+(4–3) lines, the peak of HNC emission is shifted 160 ± 15 km/s towards red, with absorption in the blue wing of the line – a P-Cygni profile, indicative of outflowing gas. We therefore hypothesise that in G09v1.40 and J1202, a significant fraction of the HNC (but not HNC or HCO+) emission arises from a molecular outflow.
Looking at the moment-0 maps, the dust, HCN, HCO+, and HNC emission can be considered co-spatial for almost all the sources – with the exception of NAv1.195. As is shown in Fig. 11, in this source, the dust (peak S/N ≃ 9) and HCN(4–3) surface brightness distribution (peak S/N ≃ 6) peak the same position. However, HCO+(4–3) (peak S/N ≈ 5) is offset to the south by ≈2.5″. This offset is comparable to the synthesised beam FWHM (2.8″ × 1.6″) and thus likely to be physical. The HCN/HCO+ enhancement in the north of the source could be caused, for example, by a buried AGN (see Section 4.3).
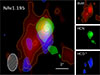 |
Fig. 11. Spatial offsets between HCN (green) HCO+ (blue) and dust (red) emission in NAv1.195. The contours are drawn at ±(2, 4, 6, …)σ for the continuum, and ±(2, 3, 4, …)σ for the lines. The HCO+(4–3) emission peaks ≈2.5″ to the south of HCN and dust continuum. These offsets suggest that different dense-gas tracers do not necessarily trace the same gas. |
4.7.2. Differential magnification
In gravitational lensing, different spatial distributions of different tracers will cause them to be magnified by a different factor – the so-called differential magnification (e.g. Serjeant 2012). Namely, if the CO(1–0) emission is much more extended than HCN or FIR continuum and thus extends to low-magnification regions, the total magnification factor for CO will be smaller than for the more compact HCN or FIR. This would artificially inflate the observed HCN/CO ratios, while HCN/FIR will be less affected, as dense gas and obscured star-formation are likely almost co-spatial (and we can thus apply magnifications derived for FIR continuum to dense-gas tracers).
For example, in SDP.81, the difference between FIR and CO(3–2) magnifications is ≤10% (Rybak et al. 2020). Similarly, Cañameras et al. (2018) found that CO and FIR magnifications differ by ≤20% in a sample of nine lensed DSFGs from the Planck sample. In extreme case of SDP.9 – which, as a very compact source, is particularly sensitive to differential magnification – Massardi et al. (2018) find a 50% difference between the magnification of the FIR continuum and the stellar component. Typical differences in CO and FIR continuum magnifications are therefore likely ≤50%. Overall, the high HCN/CO values are likely physical, and not driven by the differential magnification.
4.7.3. The HCN-to-dense-gas conversion factor
The most significant systematic uncertainty for the interpretation of our results is the conversion factor between the HCN luminosity and dense-gas mass (Eq. 5). In particular, there is a considerable uncertainty regarding the ‘effective’ gas density traced by the HCN(1–0) emission. Specifically, spatially resolved studies of Galactic molecular clouds have shown that on (sub-)parsec scales, a significant fraction of HCN(1–0) emission is associated with densities as low as 103 cm−3 (Kauffmann et al. 2017; Evans et al. 2020). Similarly, magneto-hydrodynamic simulations of individual molecular clouds indicate that HCN(1–0) traces gas with a mean density of ≈3 × 103 cm−3 (Jones et al. 2023). However, recent observations by Jiménez-Donaire et al. (2023) have shown that in nearby galaxies, HCN(1–0) directly correlates with N2H+ emission on kiloparsec scales. As N2H+ is considered an unambiguous tracer of dense gas in molecular clouds (N2H+ traces gas with characteristic density ≈4 × 103 cm−3, Kauffmann et al. 2017), this implies that on galactic scales, HCN remains a reliable tracer dense gas.
Gao & Solomon (2004b) estimated αHCN = 10 M⊙/(K km s−1 pc2) using two approaches: (1) large velocity-gradient modelling; and (2) considering optically thick emission from a virialised cloud10. However, this conversion factor is far from universal. As already noted by Gao & Solomon (2004b), αHCN has to differ significantly between individual galaxies. For example, many z ≈ 0 ULIRGs have HCN(1–0)/CO(1–0) luminosity ratios ≥0.1 (see Fig. 8); assuming αHCN = 10 and αCO = 0.8 would yield dense-gas fractions in the excess of 100% – a clearly unphysical result. This was confirmed by Graciá-Carpio et al. (2008) who found that αHCN decreases by a factor of ≈2.5 over the LFIR = 1011 − 1012 L⊙ range, based on LVG modelling of HCN/HCO+ (1−0) and (3−2) lines. Finally, spatially resolved ALMA observations of HCN and CO emission in J0209 imply αHCN ≤ 2 (Rybak, Geesink et al., in prep.).
Conversely, several studies of nearby galaxies report αHCN ≥ 10. For example, Papadopoulos et al. (2014) derived αHCN = 20 − 60 for Arp 193 and NGC 6240; for the latter galaxy, Tunnard et al. (2015) report  . More recently, very elevated αHCN ≈ 100 has been reported for individual clouds in the Milky Way (Dame & Lada 2023) and Andromeda (Forbrich et al. 2023). However, as these would imply fdense ≥ 100%, these are clearly not applicable to all DSFGs, although the actual αHCN value might vary significantly between individual sources.
Simulations of individual star-forming clouds and galaxies also support αHCN ≤ 10. On cloud scales, Onus et al. (2018) found αHCN = 16 ± 4; while Jones et al. (2023) found αHCN = 6.8 ± 3.8 in simulations of colliding clouds, with high-velocity collisions showing αHCN ≤ 3. On galactic scales, simulations by Vollmer et al. (2025) predict a mean αHCN = 11 ± 4 and 12 ± 7 for high-redshift starburst and main-sequence galaxies, respectively, with αHCN ≈ 6 for z = 0 − 0.5 LIRGs.
A variable αHCN which decreases at high SFR would in fact reinforce our main findings. Specifically, our inferred Mdense = αHCNL′HCN(1 − 0) would become even smaller, further increasing the dense-gas star-forming efficiency. In other words, in the HCN/FIR – SFR plane (Fig. 8, left), our datapoints would shift downwards, towards very short depletion times (≤10 Myr). Similarly, in the HCN/CO – SFR plane (Fig. 8, right), our data points would shift downwards, towards even lower dense-gas fraction.
Finally, it is possible that αCO is ≥1 in (some) high-redshift DSFGs (e.g. Harrington et al. 2021). In such a case, the inferred dense-gas fractions would decrease even further. On the other hand, the inferred τdense – which is independent of L′CO(1 − 0) – would remain unchanged.
5. Conclusions
We have presented results of the NOEMA and ALMA survey of dense-gas tracers – HCN, HCO+, and HNC – in 11 z = 1.6 − 3.1 DSFGs. This is the largest study of dense-gas tracers in z ≥ 1 galaxies to date. Our main results are:
-
We detect dense-gas tracers in 10 out of 11 galaxies. In total, we detect 34 transitions of HCN, HCO+, and HNC, increasing the number of z ≥ 1 detections by more than a factor of four. Only one galaxy (G15v2.235) is not detected in any spectral line. Additionally, we also detect several transitions of 13CO, C18O, and CN.
-
The linewidths of HCN, HCO+, and HNC lines are generally consistent within 1σ uncertainty. However, in G09v1.40 and J1202, the HNC lines show structures indicative of molecular outflows. In one source – NAv1.195 – the HCN and HCO+ emission appear to be spatially offset from each other.
-
We derive the excitation coefficients for the HCN, HCO+, and HNC Jupp = 3 and 4 lines, and find that DSFGs have more excited dense-gas ladders than z ≈ 0 (U)LIRGs.
-
High-redshift DSFGs have systematically lower HCN(1–0)/FIR ratios compared to present-day star-forming galaxies. This trend agrees qualitatively with a break in the HCN-FIR correlation predicted by some theoretical models (e.g. Krumholz & Thompson 2007).
-
Assuming αHCN = 10 from Gao & Solomon (2004b), we find a median dense-gas depletion timescale of ≈24 Myr. These results indicate that high-redshift DSFGs had higher star-forming efficiency than present-day galaxies.
-
High-redshift DSFGs have a wide range of dense-gas fractions, with HCN/CO ratios ranging from ≈0.01 to ≈0.15. This likely reflects variations in the amount and extent of molecular gas between individual galaxies.
-
We put the first constraints on the redshift evolution of the Cosmic dense-gas mass density, which tentatively increases by a factor of 7.4 ± 6.0 between z = 0 and z ≈ 2.5. This trend is consistent with the evolution of the total molecular gas mass density if ≈3.5% of the total molecular gas is in the high-density regime.
This work opens a new chapter in studies of dense gas and star formation in early galaxies. As is underlined by the large number of detections, systematic surveys of dense gas in early galaxies with ALMA and NOEMA – aided by gravitational lensing – are now feasible. Systematic studies of dense gas across cosmic time can provide a powerful benchmark for upcoming cosmological hydrodynamical simulations that directly include cold, dense gas (e.g. COLIBRE, Schaye et al. 2025). Future observations will allow us to extend these studies to larger samples and down to sub-galactic scales.
Acknowledgments
The authors thank Z. Zhang for sharing the data from Zhang et al. (2014) and providing valuable insights into the local dense-gas observations. This work is based on observations carried out under project numbers S21CB and S23CB with the IRAM NOEMA Interferometer. IRAM is supported by INSU/CNRS (France), MPG (Germany) and IGN (Spain). The research leading to these results has received funding from the European Union’s Horizon 2020 research and innovation programme under grant agreement No 101004719 [ORP]. This paper makes use of the following ALMA data: #2016.1.00663.S, #2017.1.01694.S, #2018.1.00747.S, and #2023.1.00432.S. ALMA is a partnership of ESO (representing its member states), NSF (USA) and NINS (Japan), together with NRC (Canada), MOST and ASIAA (Taiwan), and KASI (Republic of Korea), in cooperation with the Republic of Chile. The Joint ALMA Observatory is operated by ESO, AUI/NRAO and NAOJ. The authors acknowledge assistance from Allegro, the European ALMA Regional Center node in the Netherlands. M.R. is supported by the NWO Veni project “Under the lens” (VI.Veni.202.225). J.A.H. acknowledges support from the ERC Consolidator Grant 101088676 (VOYAJ). D.R. gratefully acknowledges support from the Collaborative Research Center 1601 (SFB 1601 sub-projects C1, C2, C3, and C6) funded by the Deutsche Forschungsgemeinschaft (DFG) – 500700252. T.R.G. is grateful for support from the Carlsberg Foundation via grant No. CF20-0534. S.V. acknowledges support from the European Research Council (ERC) grant MOPPEX ERC-833460. The Cosmic Dawn Center (DAWN) is funded by the Danish National Research Foundation under grant No. 140.
References
- Aalto, S., Monje, R., & Martín, S. 2007, A&A, 475, 479 [CrossRef] [EDP Sciences] [Google Scholar]
- Amvrosiadis, A., Wardlow, J. L., Birkin, J. E., et al. 2025, MNRAS, 536, 3757 [Google Scholar]
- Baan, W. A., Henkel, C., Loenen, A. F., Baudry, A., & Wiklind, T. 2008, A&A, 477, 747 [NASA ADS] [CrossRef] [EDP Sciences] [Google Scholar]
- Barcos-Muñoz, L., Leroy, A. K., Evans, A. S., et al. 2017, ApJ, 843, 117 [CrossRef] [Google Scholar]
- Béthermin, M., Greve, T. R., De Breuck, C., et al. 2018, A&A, 620, A115 [NASA ADS] [CrossRef] [EDP Sciences] [Google Scholar]
- Bigiel, F., Leroy, A. K., Blitz, L., et al. 2015, ApJ, 815, 103 [NASA ADS] [CrossRef] [Google Scholar]
- Boger, G. I., & Sternberg, A. 2005, ApJ, 632, 302 [NASA ADS] [CrossRef] [Google Scholar]
- Bollo, V., Péroux, C., Zwaan, M., et al. 2025, A&A, 695, A163 [NASA ADS] [CrossRef] [EDP Sciences] [Google Scholar]
- Bussmann, R. S., Narayanan, D., Shirley, Y. L., et al. 2008, ApJ, 681, L73 [NASA ADS] [CrossRef] [Google Scholar]
- Bussmann, R. S., Pérez-Fournon, I., Amber, S., et al. 2013, ApJ, 779, 25 [NASA ADS] [CrossRef] [Google Scholar]
- Butler, K. M., van der Werf, P. P., Rybak, M., et al. 2021, ApJ, 919, 5 [NASA ADS] [CrossRef] [Google Scholar]
- Butterworth, J., Viti, S., & Wang, Y. 2025, A&A, 697, A18 [NASA ADS] [CrossRef] [EDP Sciences] [Google Scholar]
- Calistro Rivera, G., Hodge, J. A., Smail, I., et al. 2018, ApJ, 863, 56 [Google Scholar]
- Cañameras, R., Nesvadba, N. P. H., Guery, D., et al. 2015, A&A, 581, A105 [Google Scholar]
- Cañameras, R., Yang, C., Nesvadba, N. P. H., et al. 2018, A&A, 620, A61 [Google Scholar]
- Cañameras, R., Nesvadba, N. P. H., Kneissl, R., et al. 2021, A&A, 645, A45 [EDP Sciences] [Google Scholar]
- Carilli, C. L., Solomon, P., Vanden Bout, P., et al. 2005, ApJ, 618, 586 [NASA ADS] [CrossRef] [Google Scholar]
- Casey, C. M., Zavala, J. A., Spilker, J., et al. 2018, ApJ, 862, 77 [Google Scholar]
- Costagliola, F., Aalto, S., Rodriguez, M. I., et al. 2011, A&A, 528, A30 [NASA ADS] [CrossRef] [EDP Sciences] [Google Scholar]
- Dame, T. M., & Lada, C. J. 2023, ApJ, 944, 197 [NASA ADS] [CrossRef] [Google Scholar]
- Danielson, A. L. R., Swinbank, A. M., Smail, I., et al. 2013, MNRAS, 436, 2793 [CrossRef] [Google Scholar]
- Dessauges-Zavadsky, M., Richard, J., Combes, F., et al. 2019, Nat. Astron., 3, 1115 [NASA ADS] [CrossRef] [Google Scholar]
- Dudzevičiūtė, U., Smail, I., Swinbank, A. M., et al. 2020, MNRAS, 494, 3828 [Google Scholar]
- Dunne, L., Maddox, S. J., Papadopoulos, P. P., Ivison, R. J., & Gomez, H. L. 2022, MNRAS, 517, 962 [NASA ADS] [CrossRef] [Google Scholar]
- Evans, N. J., II, Kim, K.-T., Wu, J., et al. 2020, ApJ, 894, 103 [NASA ADS] [CrossRef] [Google Scholar]
- Falgarone, E., Zwaan, M. A., Godard, B., et al. 2017, Nature, 548, 430 [NASA ADS] [CrossRef] [Google Scholar]
- Forbrich, J., Lada, C. J., Pety, J., & Petitpas, G. 2023, MNRAS, 525, 5565 [NASA ADS] [CrossRef] [Google Scholar]
- Frayer, D. T., Harris, A. I., Baker, A. J., et al. 2011, ApJ, 726, L22 [NASA ADS] [CrossRef] [Google Scholar]
- Frias Castillo, M., Rybak, M., Hodge, J., et al. 2022, ApJ, 930, 35 [NASA ADS] [CrossRef] [Google Scholar]
- Frias Castillo, M., Hodge, J., Rybak, M., et al. 2023, ApJ, 945, 128 [NASA ADS] [CrossRef] [Google Scholar]
- Fujimoto, S., Silverman, J. D., Bethermin, M., et al. 2020, ApJ, 900, 1 [Google Scholar]
- Gallagher, M. J., Leroy, A. K., Bigiel, F., et al. 2018, ApJ, 858, 90 [NASA ADS] [CrossRef] [Google Scholar]
- Gao, Y., & Solomon, P. M. 2004a, ApJ, 606, 271 [NASA ADS] [CrossRef] [Google Scholar]
- Gao, Y., & Solomon, P. M. 2004b, ApJS, 152, 63 [Google Scholar]
- Gao, Y., Carilli, C. L., Solomon, P. M., & Vanden Bout, P. A. 2007, ApJ, 660, L93 [NASA ADS] [CrossRef] [Google Scholar]
- García-Burillo, S., Usero, A., Alonso-Herrero, A., et al. 2012, A&A, 539, A8 [Google Scholar]
- Ginolfi, M., Jones, G. C., Béthermin, M., et al. 2020, A&A, 633, A90 [NASA ADS] [CrossRef] [EDP Sciences] [Google Scholar]
- Giulietti, M., Lapi, A., Massardi, M., et al. 2023, ApJ, 943, 151 [NASA ADS] [CrossRef] [Google Scholar]
- Graciá-Carpio, J., García-Burillo, S., Planesas, P., & Colina, L. 2006, ApJ, 640, L135 [CrossRef] [Google Scholar]
- Graciá-Carpio, J., García-Burillo, S., Planesas, P., Fuente, A., & Usero, A. 2008, A&A, 479, 703 [NASA ADS] [CrossRef] [EDP Sciences] [Google Scholar]
- Graninger, D. M., Herbst, E., Öberg, K. I., & Vasyunin, A. I. 2014, ApJ, 787, 74 [Google Scholar]
- Greve, T. R., Papadopoulos, P. P., Gao, Y., & Radford, S. J. E. 2009, ApJ, 692, 1432 [Google Scholar]
- Gruppioni, C., Pozzi, F., Rodighiero, G., et al. 2013, MNRAS, 432, 23 [Google Scholar]
- Gruppioni, C., Béthermin, M., Loiacono, F., et al. 2020, A&A, 643, A8 [NASA ADS] [CrossRef] [EDP Sciences] [Google Scholar]
- Gullberg, B., Swinbank, A. M., Smail, I., et al. 2018, ApJ, 859, 12 [Google Scholar]
- Gullberg, B., Smail, I., Swinbank, A. M., et al. 2019, MNRAS, 490, 4956 [Google Scholar]
- Hacar, A., Bosman, A. D., & van Dishoeck, E. F. 2020, A&A, 635, A4 [NASA ADS] [CrossRef] [EDP Sciences] [Google Scholar]
- Hagimoto, M., Bakx, T. J. L. C., Serjeant, S., et al. 2023, MNRAS, 521, 5508 [NASA ADS] [CrossRef] [Google Scholar]
- Harikane, Y., Ouchi, M., Oguri, M., et al. 2023, ApJS, 265, 5 [NASA ADS] [CrossRef] [Google Scholar]
- Harrington, K. C., Weiss, A., Yun, M. S., et al. 2021, ApJ, 908, 95 [NASA ADS] [CrossRef] [Google Scholar]
- Harris, A. I., Baker, A. J., Frayer, D. T., et al. 2012, ApJ, 752, 152 [NASA ADS] [CrossRef] [Google Scholar]
- Henkel, C., & Mauersberger, R. 1993, A&A, 274, 730 [NASA ADS] [Google Scholar]
- Hodge, J. A., & da Cunha, E. 2020, Roy. Soc. Open Sci., 7, 200556 [NASA ADS] [CrossRef] [Google Scholar]
- Hodge, J. A., Swinbank, A. M., Simpson, J. M., et al. 2016, ApJ, 833, 103 [Google Scholar]
- Ikeda, R., Tadaki, K.-I., Mitsuhashi, I., et al. 2025, A&A, 693, A237 [NASA ADS] [CrossRef] [EDP Sciences] [Google Scholar]
- Imanishi, M., Nakanishi, K., & Izumi, T. 2018a, ApJ, 856, 143 [Google Scholar]
- Imanishi, M., Nakanishi, K., Izumi, T., & Wada, K. 2018b, ApJ, 853, L25 [NASA ADS] [CrossRef] [Google Scholar]
- Impellizzeri, C. M. V., Gallimore, J. F., Baum, S. A., et al. 2019, ApJ, 884, L28 [NASA ADS] [CrossRef] [Google Scholar]
- Iono, D., Hatsukade, B., Kohno, K., et al. 2012, PASJ, 64, L2 [NASA ADS] [Google Scholar]
- Israel, F. P. 2023, A&A, 671, A59 [NASA ADS] [CrossRef] [EDP Sciences] [Google Scholar]
- Ivison, R. J., Papadopoulos, P. P., Smail, I., et al. 2011, MNRAS, 412, 1913 [Google Scholar]
- Izumi, T., Kohno, K., Aalto, S., et al. 2016, ApJ, 818, 42 [NASA ADS] [CrossRef] [Google Scholar]
- Jiménez-Donaire, M. J., Bigiel, F., Leroy, A. K., et al. 2017, MNRAS, 466, 49 [CrossRef] [Google Scholar]
- Jiménez-Donaire, M. J., Bigiel, F., Leroy, A. K., et al. 2019, ApJ, 880, 127 [CrossRef] [Google Scholar]
- Jiménez-Donaire, M. J., Usero, A., Bešlić, I., et al. 2023, A&A, 676, L11 [NASA ADS] [CrossRef] [EDP Sciences] [Google Scholar]
- Jin, M., Lee, J.-E., & Kim, K.-T. 2015, ApJS, 219, 2 [Google Scholar]
- Jones, G. H., Clark, P. C., Glover, S. C. O., & Hacar, A. 2023, MNRAS, 520, 1005 [NASA ADS] [CrossRef] [Google Scholar]
- Juneau, S., Narayanan, D. T., Moustakas, J., et al. 2009, ApJ, 707, 1217 [NASA ADS] [CrossRef] [Google Scholar]
- Kauffmann, J., Goldsmith, P. F., Melnick, G., et al. 2017, A&A, 605, L5 [NASA ADS] [CrossRef] [EDP Sciences] [Google Scholar]
- Kazandjian, M. V., Meijerink, R., Pelupessy, I., Israel, F. P., & Spaans, M. 2015, A&A, 574, A127 [NASA ADS] [CrossRef] [EDP Sciences] [Google Scholar]
- Kelly, B. C. 2007, ApJ, 665, 1489 [Google Scholar]
- Kohno, K. 2003, ASP Conf. Ser., 289, 349 [Google Scholar]
- König, S., Aalto, S., Muller, S., et al. 2018, A&A, 615, A122 [NASA ADS] [CrossRef] [EDP Sciences] [Google Scholar]
- Krips, M., Neri, R., García-Burillo, S., et al. 2008, ApJ, 677, 262 [NASA ADS] [CrossRef] [Google Scholar]
- Krumholz, M. R., & McKee, C. F. 2005, ApJ, 630, 250 [Google Scholar]
- Krumholz, M. R., & Thompson, T. A. 2007, ApJ, 669, 289 [NASA ADS] [CrossRef] [Google Scholar]
- Lagos, C. D. P., da Cunha, E., Robotham, A. S. G., et al. 2020, MNRAS, 499, 1948 [CrossRef] [Google Scholar]
- Li, F., Wang, J., Fang, M., et al. 2020, PASJ, 72, 41 [NASA ADS] [CrossRef] [Google Scholar]
- Lutz, D., Berta, S., Contursi, A., et al. 2016, A&A, 591, A136 [NASA ADS] [CrossRef] [EDP Sciences] [Google Scholar]
- Madau, P., & Dickinson, M. 2014, ARA&A, 52, 415 [Google Scholar]
- Magnelli, B., Elbaz, D., Chary, R. R., et al. 2011, A&A, 528, A35 [NASA ADS] [CrossRef] [EDP Sciences] [Google Scholar]
- Martín, S., Mangum, J. G., Harada, N., et al. 2021, A&A, 656, A46 [NASA ADS] [CrossRef] [EDP Sciences] [Google Scholar]
- Massardi, M., Enia, A. F. M., Negrello, M., et al. 2018, A&A, 610, A53 [NASA ADS] [CrossRef] [EDP Sciences] [Google Scholar]
- Meijerink, R., Spaans, M., & Israel, F. P. 2007, A&A, 461, 793 [NASA ADS] [CrossRef] [EDP Sciences] [Google Scholar]
- Narayanan, D., Cox, T. J., Shirley, Y., et al. 2008, ApJ, 684, 996 [NASA ADS] [CrossRef] [Google Scholar]
- Negrello, M., Hopwood, R., De Zotti, G., et al. 2010, Science, 330, 800 [NASA ADS] [CrossRef] [Google Scholar]
- Negrello, M., Amber, S., Amvrosiadis, A., et al. 2017, MNRAS, 465, 3558 [NASA ADS] [CrossRef] [Google Scholar]
- Neumann, L., Gallagher, M. J., Bigiel, F., et al. 2023, MNRAS, 521, 3348 [NASA ADS] [CrossRef] [Google Scholar]
- Nguyen, Q. R., Jackson, J. M., Henkel, C., Truong, B., & Mauersberger, R. 1992, ApJ, 399, 521 [NASA ADS] [CrossRef] [Google Scholar]
- Nishimura, Y., Aalto, S., Gorski, M. D., et al. 2024, A&A, 686, A48 [NASA ADS] [CrossRef] [EDP Sciences] [Google Scholar]
- Onus, A., Krumholz, M. R., & Federrath, C. 2018, MNRAS, 479, 1702 [NASA ADS] [CrossRef] [Google Scholar]
- Oteo, I., Zhang, Z. Y., Yang, C., et al. 2017, ApJ, 850, 170 [NASA ADS] [CrossRef] [Google Scholar]
- Papadopoulos, P. P. 2007, ApJ, 656, 792 [NASA ADS] [CrossRef] [Google Scholar]
- Papadopoulos, P. P., Zhang, Z.-Y., Xilouris, E. M., et al. 2014, ApJ, 788, 153 [CrossRef] [Google Scholar]
- Planck Collaboration XIII. 2016, A&A, 594, A13 [NASA ADS] [CrossRef] [EDP Sciences] [Google Scholar]
- Privon, G. C., Herrero-Illana, R., Evans, A. S., et al. 2015, ApJ, 814, 39 [CrossRef] [Google Scholar]
- Privon, G. C., Ricci, C., Aalto, S., et al. 2020, ApJ, 893, 149 [NASA ADS] [CrossRef] [Google Scholar]
- Rangwala, N., Maloney, P. R., Glenn, J., et al. 2011, ApJ, 743, 94 [NASA ADS] [CrossRef] [Google Scholar]
- Reuter, C., Spilker, J. S., Vieira, J. D., et al. 2023, ApJ, 948, 44 [NASA ADS] [CrossRef] [Google Scholar]
- Riechers, D. A., Walter, F., Carilli, C. L., et al. 2006, ApJ, 645, L13 [NASA ADS] [CrossRef] [Google Scholar]
- Riechers, D. A., Walter, F., Cox, P., et al. 2007, ApJ, 666, 778 [Google Scholar]
- Riechers, D. A., Weiß, A., Walter, F., & Wagg, J. 2010, ApJ, 725, 1032 [NASA ADS] [CrossRef] [Google Scholar]
- Riechers, D. A., Hodge, J., Walter, F., Carilli, C. L., & Bertoldi, F. 2011, ApJ, 739, L31 [Google Scholar]
- Riechers, D. A., Pavesi, R., Sharon, C. E., et al. 2019, ApJ, 872, 7 [Google Scholar]
- Romano, D., & Matteucci, F. 2003, MNRAS, 342, 185 [Google Scholar]
- Romano, D., Matteucci, F., Zhang, Z. Y., Papadopoulos, P. P., & Ivison, R. J. 2017, MNRAS, 470, 401 [NASA ADS] [CrossRef] [Google Scholar]
- Rybak, M., Calistro Rivera, G., Hodge, J. A., et al. 2019, ApJ, 876, 112 [Google Scholar]
- Rybak, M., Hodge, J. A., Vegetti, S., et al. 2020, MNRAS, 494, 5542 [NASA ADS] [CrossRef] [Google Scholar]
- Rybak, M., Hodge, J. A., Greve, T. R., et al. 2022, A&A, 667, A70 [NASA ADS] [CrossRef] [EDP Sciences] [Google Scholar]
- Rybak, M., van Marrewijk, J., Hodge, J. A., et al. 2023, A&A, 679, A119 [NASA ADS] [CrossRef] [EDP Sciences] [Google Scholar]
- Rybak, M., Jansen, J. T., Frias Castillo, M., et al. 2025, A&A, 700, A278 [NASA ADS] [CrossRef] [EDP Sciences] [Google Scholar]
- Sabatini, G., Bovino, S., Giannetti, A., et al. 2021, A&A, 652, A71 [NASA ADS] [CrossRef] [EDP Sciences] [Google Scholar]
- Sage, L. J., Mauersberger, R., & Henkel, C. 1991, A&A, 249, 31 [NASA ADS] [Google Scholar]
- Saintonge, A., & Catinella, B. 2022, ARA&A, 60, 319 [NASA ADS] [CrossRef] [Google Scholar]
- Sakamoto, K., Aalto, S., Evans, A. S., Wiedner, M. C., & Wilner, D. J. 2010, ApJ, 725, L228 [Google Scholar]
- Salim, D. M., Alatalo, K., Federrath, C., Groves, B., & Kewley, L. J. 2020, ApJ, 893, 26 [Google Scholar]
- Salpeter, E. E. 1955, ApJ, 121, 161 [Google Scholar]
- Schaye, J., Chaikin, E., Schaller, M., et al. 2025, ArXiv e-prints [arXiv:2508.21126] [Google Scholar]
- Schinnerer, E., & Leroy, A. K. 2024, ARA&A, 62, 369 [NASA ADS] [CrossRef] [Google Scholar]
- Serjeant, S. 2012, MNRAS, 424, 2429 [NASA ADS] [CrossRef] [Google Scholar]
- Solomon, P., Vanden Bout, P., Carilli, C., & Guelin, M. 2003, Nature, 426, 636 [CrossRef] [PubMed] [Google Scholar]
- Spilker, J. S., Marrone, D. P., Aguirre, J. E., et al. 2014, ApJ, 785, 149 [NASA ADS] [CrossRef] [Google Scholar]
- Stanley, F., Jones, B. M., Riechers, D. A., et al. 2023, ApJ, 945, 24 [NASA ADS] [CrossRef] [Google Scholar]
- Stuber, S. K., Pety, J., Usero, A., et al. 2025, A&A, 696, A182 [NASA ADS] [CrossRef] [EDP Sciences] [Google Scholar]
- Tacconi, L. J., Genzel, R., Saintonge, A., et al. 2018, ApJ, 853, 179 [Google Scholar]
- Tacconi, L. J., Genzel, R., & Sternberg, A. 2020, ARA&A, 58, 157 [NASA ADS] [CrossRef] [Google Scholar]
- Tan, Q.-H., Gao, Y., Zhang, Z.-Y., et al. 2018, ApJ, 860, 165 [NASA ADS] [CrossRef] [Google Scholar]
- Tunnard, R., Greve, T. R., Garcia-Burillo, S., et al. 2015, ApJ, 815, 114 [NASA ADS] [CrossRef] [Google Scholar]
- Usero, A., Leroy, A. K., Walter, F., et al. 2015, AJ, 150, 115 [Google Scholar]
- Valtchanov, I., Virdee, J., Ivison, R. J., et al. 2011, MNRAS, 415, 3473 [NASA ADS] [CrossRef] [Google Scholar]
- van der Vlugt, D., Hodge, J. A., Algera, H. S. B., et al. 2022, ApJ, 941, 10 [NASA ADS] [CrossRef] [Google Scholar]
- Vanden Bout, P. A., Solomon, P. M., & Maddalena, R. J. 2004, ApJ, 614, L97 [NASA ADS] [CrossRef] [Google Scholar]
- Viti, S. 2017, A&A, 607, A118 [NASA ADS] [CrossRef] [EDP Sciences] [Google Scholar]
- Vollmer, B., Freundlich, J., Gratier, P., et al. 2025, A&A, 693, A267 [NASA ADS] [CrossRef] [EDP Sciences] [Google Scholar]
- Wagg, J., Wilner, D. J., Neri, R., Downes, D., & Wiklind, T. 2005, ApJ, 634, L13 [NASA ADS] [CrossRef] [Google Scholar]
- Walter, F., Carilli, C., Neeleman, M., et al. 2020, ApJ, 902, 111 [Google Scholar]
- Wardlow, J. L., Cooray, A., Osage, W., et al. 2017, ApJ, 837, 12 [NASA ADS] [CrossRef] [Google Scholar]
- Wilson, C. D., Petitpas, G. R., Iono, D., et al. 2008, ApJS, 178, 189 [Google Scholar]
- Wilson, C. D., Bemis, A., Ledger, B., & Klimi, O. 2023, MNRAS, 521, 717 [NASA ADS] [CrossRef] [Google Scholar]
- Wu, J., Evans, N. J., Gao, Y., et al. 2005, ApJ, 635, L173 [NASA ADS] [CrossRef] [Google Scholar]
- Yang, C., Omont, A., Beelen, A., et al. 2017, A&A, 608, A144 [NASA ADS] [CrossRef] [EDP Sciences] [Google Scholar]
- Yang, C., Omont, A., Martín, S., et al. 2023, A&A, 680, A95 [NASA ADS] [CrossRef] [EDP Sciences] [Google Scholar]
- Zavala, J. A., Casey, C. M., Manning, S. M., et al. 2021, ApJ, 909, 165 [CrossRef] [Google Scholar]
- Zhang, Z.-Y., Gao, Y., Henkel, C., et al. 2014, ApJ, 784, L31 [NASA ADS] [CrossRef] [Google Scholar]
- Zhang, Z.-Y., Romano, D., Ivison, R. J., Papadopoulos, P. P., & Matteucci, F. 2018, Nature, 558, 260 [Google Scholar]
In this work, we consider DSFGs to have continuum flux at 850-μm (observed-frame) S850 μm ≥ 1 mJy.
While the definition of ‘dense’ gas is arbitrary, following Gao & Solomon (2004a), we consider gas with n ≥ 3 × 104 cm−3 as dense.
In addition to these star-formation dominated galaxies, several high-z QSOs have been detected in the HCN(1–0) (Solomon et al. 2003; Vanden Bout et al. 2004; Carilli et al. 2005) or HCO+(1–0) (e.g. Riechers et al. 2006).
Prussic acid is an alternative name for HCN, which was first isolated from the Prussian blue pigment.
Throughout this paper, we assume a flat ΛCDM cosmology, with Ωm = 0.315 and H0 = 67.4 km s−1 Mpc−1 (Planck Collaboration XIII 2016), and the Salpeter initial stellar mass function (IMF, Salpeter 1955).
We fit the data in the log-log space using the LINMIX package (Kelly 2007) which explicitly includes non-detections.
The original fit from Zhang et al. (2014, p. 4) contains a typo; we give the correct form (Z. Zhang, priv. comm.).
While the stellar mass functions at high redshift are better observationally constrained, the stellar masses of dusty DSFGs are highly uncertain. Moreover, for lensed sources, the light from the background galaxy is blended with that from the foreground lens.
In the inner regions of nearby galaxies, the HCN and HCO+ lines are usually moderately optically thick, with an optical depth of 1−2 (e.g. Jiménez-Donaire et al. 2017).
Appendix A: Details of NOEMA and ALMA observations
Table A.1 summarises the details of NOEMA and ALMA observations.
Observations summary. Individual columns list: target ID, dates of observations, HCN transition targeted, on-source time, synthesised beam FWHM and position angle, and rms noise over a 100 km s−1 bandwidth at the position of the HCN line.
Appendix B: Imaging and spectra
Figures B.1 and B.2 present synthesised images of the continuum for individual sources, obtained with NOEMA and ALMA, respectively. For NOEMA observations, we show images for the upper and lower sideband separately.
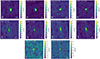 |
Fig. B.1. NOEMA Band 1/2 continuum imaging of individual galaxies. The observed-frame frequencies are given in each panel. For each target, we show separate images for the lower and upper sidebands. All images were produced using natural weighting. Contours start at ±2σ and terminate at 20σ, with a 2σ increment. All sources are detected in the continuum emission and are marginally resolved. |
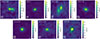 |
Fig. B.2. ALMA Band 3/4 continuum imaging of our targets. All images were produced using natural weighting. Contours start at ±2σ, with a 2σ increment. All sources are clearly detected in the continuum emission. G09v1.326 and NAv1.195 are resolved into two point-like sources due to the lensing morphology. SDP.130 is blended with a fainter galaxy (at a different redshift) to the south-west. |
Figures B.3 and B.4 present the narrow-band images for the HCN, HCO+, and HNC lines for individual sources. Finally, Fig. B.5 and B.5 present the spectra extracted for individual sources. Table B.1 lists the fluxes for individual tracers inferred from the mom-0 maps.
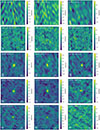 |
Fig. B.3. Figure 2 continued: NOEMA narrow-band images of the HCN/HCO+/HNC lines in individual sources. The field of view is 20”times20”; contours start at ±2σ and increase in steps of 2σ. J0209 is clearly detected in all lines except HCN(4–3), J1202 is detected in all transitions. SDP.130 is not detected in any transition. |
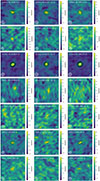 |
Fig. B.4. Figure 2 continued: ALMA narrow-band images of the HCN/HCO+/HNC lines for individual sources. Contours are drawn at ±(2,3,...10)σ. |
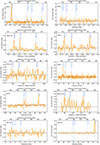 |
Fig. B.5. Spectra for individual targets, after continuum subtraction. In SDP.9, we detect HCN, HCO+, and HNC(4–3) lines. For SDP.11, no lines are detected. In J0209, besides HCN, HCO+, and HNC, we also detect the 13CO, C18O and CN emission. We do not detect any dense-gas tracers in SDP.130. Note the blue-shifted HCN(3–2) emission in G09v1.40, which might be coming from a molecular outflow. |
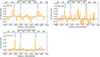 |
Fig. B.5. continued. |
Line flux measurements from moment-0 images, not corrected for the lensing magnification.
Appendix C: Detections of CO isotopologues: 13CO and C18O
In J0209 and J1202, our NOEMA spectral setup covers the CO(3–2) isotopologues 13CO(3–2) (f0 = 330.588 GHz) and C18O(3–2) (f0 = 329.331 GHz). As is shown in Fig. D.1, we detect both transitions in both sources; the measured fluxes and luminosities are reported in Tab. D.1. The 13CO/C18O isotopologues luminosity ratios in J0209 and J1202 are L′13CO/L′C18O = 1.8±0.6 and 1.1±0.1, respectively. These are consistent with previous results for high-redshift DSFGs by (Zhang et al. 2018; Yang et al. 2023), and with the lower limit from the Spilker et al. (2014) spectral stack (13CO/C18O(3–2)≥1.1).
The 13CO/C18O ratio has been proposed as a potentially sensitive tracer of the IMF in obscured galaxies (e.g. Sage et al. 1991; Henkel & Mauersberger 1993; Romano & Matteucci 2003; Romano et al. 2017). This is because 13C and 18O are produced and dispersed via different routes. Namely 13CO is primarily produced by low/intermediate-mass stars and novae (M★ ≤ 8 M⊙), whereas C18O production is dominated by high-mass stars. In the Milky Way, 13CO/C18O luminosity ratio is ≈7 (Romano et al. 2017); lower 13CO/C18O ratios would thus indicate an excess of massive stars - a top-heavy IMF. Indeed, previous studies of CO isotopologues in DSFGs by Zhang et al. (2018), Yang et al. (2023) have found ratios close to unity. Taken at the face value, CO isotopologue ratios in J0209 and J1202 are consistent with a top-heavy IMF. However, there are considerable uncertainties in linking CO isotopologue ratios to the IMF slope, particularly when stellar rotation is taken into account (C. Kobayashi, priv. comm.)
Appendix D: Detections of CN
In J0209 and J1202, we obtain strong detection of the cyanide radical CN(N = 3 − 2) transition (with different fine- and hyperfine structure transition spanning f0 = 339.447 − 340.279 GHz). CN arises primarily from regions exposed to strong ultraviolet (UV) or X-ray radiation (e.g. Boger & Sternberg 2005; Meijerink et al. 2007) The total flux of the CN(3–2) transitions is 2.9±0.3 Jy km/s in J1202 and 3.7±0.2 Jy km/s in J1202 (Tab. D.1), which corresponds to L′CN(3 − 2) = (1.0 ± 0.1)×1011 and L′CN(3 − 2) = (1.2 ± 0.1)×1011 K km s−1 pc2, respectively.
Adopting the CO(3–2) luminosities from Harrington et al. (2021), we find CN(3–2)/CO(3–2) luminosity ratios of 0.15±0.04 and 0.17±0.05, respectively. These are comparable to measurements for the Cloverleaf quasar at z = 2.5 (CN(3–2)/CO(3–2) ratio of 0.11±0.02 (Riechers et al. 2007), but significantly higher than values reported for NCv1.143 (CN/CO = 0.06, Yang et al. 2023) and for the spectral stack of SPT-selected galaxies (0.04, Reuter et al. 2023). Curiously, the CN(3–2) luminosities in J0209 and J1202 are about twice that of HCN(3–2) line (CN/HCN = 1.8±0.3 and 2.0±0.4, respectively), in contrast to nearby star-forming galaxies, which show an almost-constant CN/HCN ratio of 0.86 ± 0.27 (Wilson et al. 2023).
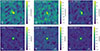 |
Fig. D.1. Detections of CO isotopologues and CN lines in J0209 and J1202. Contours start at ±2σ and increase in steps of 2σ. |
Flux densities of CO isotopologues and CN transitioms in J0209 and J1202, in units of Jy km/s. The reported fluxes are not corrected for lensing magnification.
All Tables
Rest-frame frequencies and luminosities (in units of 108 K km s−1 pc2) for HCN, HCO+, and HNC lines in individual galaxies.
HCN, HCO+, and HNC FWHM linewidths for individual sources, inferred from one-dimensional Gaussian fits to the observed (i.e. not de-lensed) spectra.
Dense-gas masses, fractions, and dense-gas and molecular-gas depletion timescales for individual galaxies.
Observations summary. Individual columns list: target ID, dates of observations, HCN transition targeted, on-source time, synthesised beam FWHM and position angle, and rms noise over a 100 km s−1 bandwidth at the position of the HCN line.
Line flux measurements from moment-0 images, not corrected for the lensing magnification.
Flux densities of CO isotopologues and CN transitioms in J0209 and J1202, in units of Jy km/s. The reported fluxes are not corrected for lensing magnification.
All Figures
|
Fig. 1. NOEMA Band-1/2 spectra for J1202. We detect the HCN, HCO+, HNC (3–2) and (4–3) lines, alongside the CO(3–2) isotopologues and CN(3–2). The HNC(3–2) and (4–3) line profiles differ significantly from those of HCN and HCO+. See Appendix B for the spectra of remaining targets. |
| In the text | |
|
Fig. 2. NOEMA narrow-band images of the HCN/HCO+/HNC lines for SDP.9, which is detected in all three transitions. For the remaining sources, see Appendix B. Contours start at ±2σ and increase in steps of 2σ. |
| In the text | |
|
Fig. 3. Correlation between far-IR luminosity and HCN/HCO+(3–2) and (4–3) luminosities. Solid/dashed orange lines indicate the empirical trends from this work and Zhang et al. (2014) with ±1σ scatter; dotted orange lines indicate the empirical trend from Nishimura et al. (2024). Individual data points show z = 0 galaxy-averaged (Greve et al. 2009; Papadopoulos et al. 2014; Zhang et al. 2014; Nishimura et al. 2024) and resolved observations (Tan et al. 2018), and high-z detections in individual galaxies (Riechers et al. 2011; Cañameras et al. 2021, black, solid) and this work (blue). We also show results from spectral stacks (Reuter et al. 2023; Hagimoto et al. 2023). Where appropriate, we corrected for the lensing magnification. We also plot error bars on high-z measurements; these are typically smaller than the symbol size. |
| In the text | |
|
Fig. 4. HCO+/HCN and HNC/CO luminosity ratios in our sample (solid circles). We also include data from Yang et al. (2023) for comparison (empty squares). The shaded regions indicate HCO+/HCN and HNC/HNC ratios for the EMPIRE sample (Jiménez-Donaire et al. 2019). HCN is the brightest line in most of our targets. SDP.81 shows strong HCO+ enhancement, potentially due to low metallicity (Rybak et al. 2023). The HCN(3–2) emission line in SDP.11 is unusually bright, potentially due to AGN-driven chemistry. |
| In the text | |
|
Fig. 5. Comparison of CO, HCN, HCO+, and HNC linewidths in individual galaxies, ordered by increasing CO linewidth. The linewidths of different tracers are generally consistent within 1σ uncertainties. Note the large discrepancies between HCN/HCO+ and HNC linewidths in G04v1.40 and J1202. |
| In the text | |
|
Fig. 6. Excitation coefficients of HCN, HCO+, and HNC in DSFGs from our sample (coloured), normalised to the (1−0) transition and compared to z ∼ 0 galaxies from the Israel (2023) compilation (grey). The arrows indicate the 3σ upper/lower limits. For comparison, we highlight SLEDs for nearby (U)LIRGs NGC 253, NGC 1068, and NGC 6946. In J0209 and J1202, the HCN and HCO+ SLEDs appear to be superthermalised. The sparseness of the HNC plot reflects the lack of detections at z ≈ 0. |
| In the text | |
|
Fig. 7. HCN(1–0) vs FIR luminosity (8−1000 μm) for our sample (blue), compared to other high-redshift (black) and selected low-redshift (grey) measurements for entire galaxies (Gao & Solomon 2004a; Graciá-Carpio et al. 2008; Krips et al. 2008; García-Burillo et al. 2012; Privon et al. 2015), and the empirical linear trend from Jiménez-Donaire et al. (2019, red). Our measurements fall systematically below the linear HCN-FIR correlation. |
| In the text | |
|
Fig. 8. Left: Ratio of HCN(1–0) and FIR luminosities (a proxy for star-forming efficiency) as a function of star-formation rate. The dotted lines indicate the mean and 1σ scatter for local galaxies from the EMPIRE sample (Jiménez-Donaire et al. 2019). We infer HCN(1–0) luminosities for our DSFGs using the following excitation coefficients: r31 = 0.41 and r41 = 0.59. Right: Ratio of HCN(1–0) and CO(1–0) luminosities (a proxy for the dense-gas fraction). The inferred HCN/CO ratios span ≈1 dex, suggesting that dense-gas fraction in high-z DSFGs vary significantly source-to-source. |
| In the text | |
|
Fig. 9. Depletion timescales for the total molecular gas τmol (orange, based on CO(1–0)) and dense gas τdense (blue, based on HCN) for individual DSFGs from our sample. The gas masses are derived using αCO = 1 and αHCN = 10. In several galaxies, τdense ≥ τmol; this indicates that αCO and/or αHCN deviate from the assumed values. The median dense-gas depletion timescale is 24 Myr. |
| In the text | |
|
Fig. 10. Redshift evolution of dense-gas mass density between the present-day (black point). The blue and purple points show dense-gas mass density inferred using the far-IR LFs from Zavala et al. (2021, blue) and Gruppioni et al. (2020, purple), respectively. The z ≈ 0 point (black) is inferred using HCN/FIR ratio from Jiménez-Donaire et al. (2019). We also show the upper limit from Rybak et al. (2022). Orange line points shows the evolution of total molecular gas density ρmol from Walter et al. (2020, orange solid line). Grey dashed line shows the Walter et al. (2020) trend normalised to match ρdense at z = 0. The ρdense evolution is consistent with the redshift evolution of ρmol with a constant dense-gas fraction of ≈3.5%. |
| In the text | |
|
Fig. 11. Spatial offsets between HCN (green) HCO+ (blue) and dust (red) emission in NAv1.195. The contours are drawn at ±(2, 4, 6, …)σ for the continuum, and ±(2, 3, 4, …)σ for the lines. The HCO+(4–3) emission peaks ≈2.5″ to the south of HCN and dust continuum. These offsets suggest that different dense-gas tracers do not necessarily trace the same gas. |
| In the text | |
|
Fig. B.1. NOEMA Band 1/2 continuum imaging of individual galaxies. The observed-frame frequencies are given in each panel. For each target, we show separate images for the lower and upper sidebands. All images were produced using natural weighting. Contours start at ±2σ and terminate at 20σ, with a 2σ increment. All sources are detected in the continuum emission and are marginally resolved. |
| In the text | |
|
Fig. B.2. ALMA Band 3/4 continuum imaging of our targets. All images were produced using natural weighting. Contours start at ±2σ, with a 2σ increment. All sources are clearly detected in the continuum emission. G09v1.326 and NAv1.195 are resolved into two point-like sources due to the lensing morphology. SDP.130 is blended with a fainter galaxy (at a different redshift) to the south-west. |
| In the text | |
|
Fig. B.3. Figure 2 continued: NOEMA narrow-band images of the HCN/HCO+/HNC lines in individual sources. The field of view is 20”times20”; contours start at ±2σ and increase in steps of 2σ. J0209 is clearly detected in all lines except HCN(4–3), J1202 is detected in all transitions. SDP.130 is not detected in any transition. |
| In the text | |
|
Fig. B.4. Figure 2 continued: ALMA narrow-band images of the HCN/HCO+/HNC lines for individual sources. Contours are drawn at ±(2,3,...10)σ. |
| In the text | |
|
Fig. B.5. Spectra for individual targets, after continuum subtraction. In SDP.9, we detect HCN, HCO+, and HNC(4–3) lines. For SDP.11, no lines are detected. In J0209, besides HCN, HCO+, and HNC, we also detect the 13CO, C18O and CN emission. We do not detect any dense-gas tracers in SDP.130. Note the blue-shifted HCN(3–2) emission in G09v1.40, which might be coming from a molecular outflow. |
| In the text | |
|
Fig. B.5. continued. |
| In the text | |
|
Fig. D.1. Detections of CO isotopologues and CN lines in J0209 and J1202. Contours start at ±2σ and increase in steps of 2σ. |
| In the text | |
Current usage metrics show cumulative count of Article Views (full-text article views including HTML views, PDF and ePub downloads, according to the available data) and Abstracts Views on Vision4Press platform.
Data correspond to usage on the plateform after 2015. The current usage metrics is available 48-96 hours after online publication and is updated daily on week days.
Initial download of the metrics may take a while.