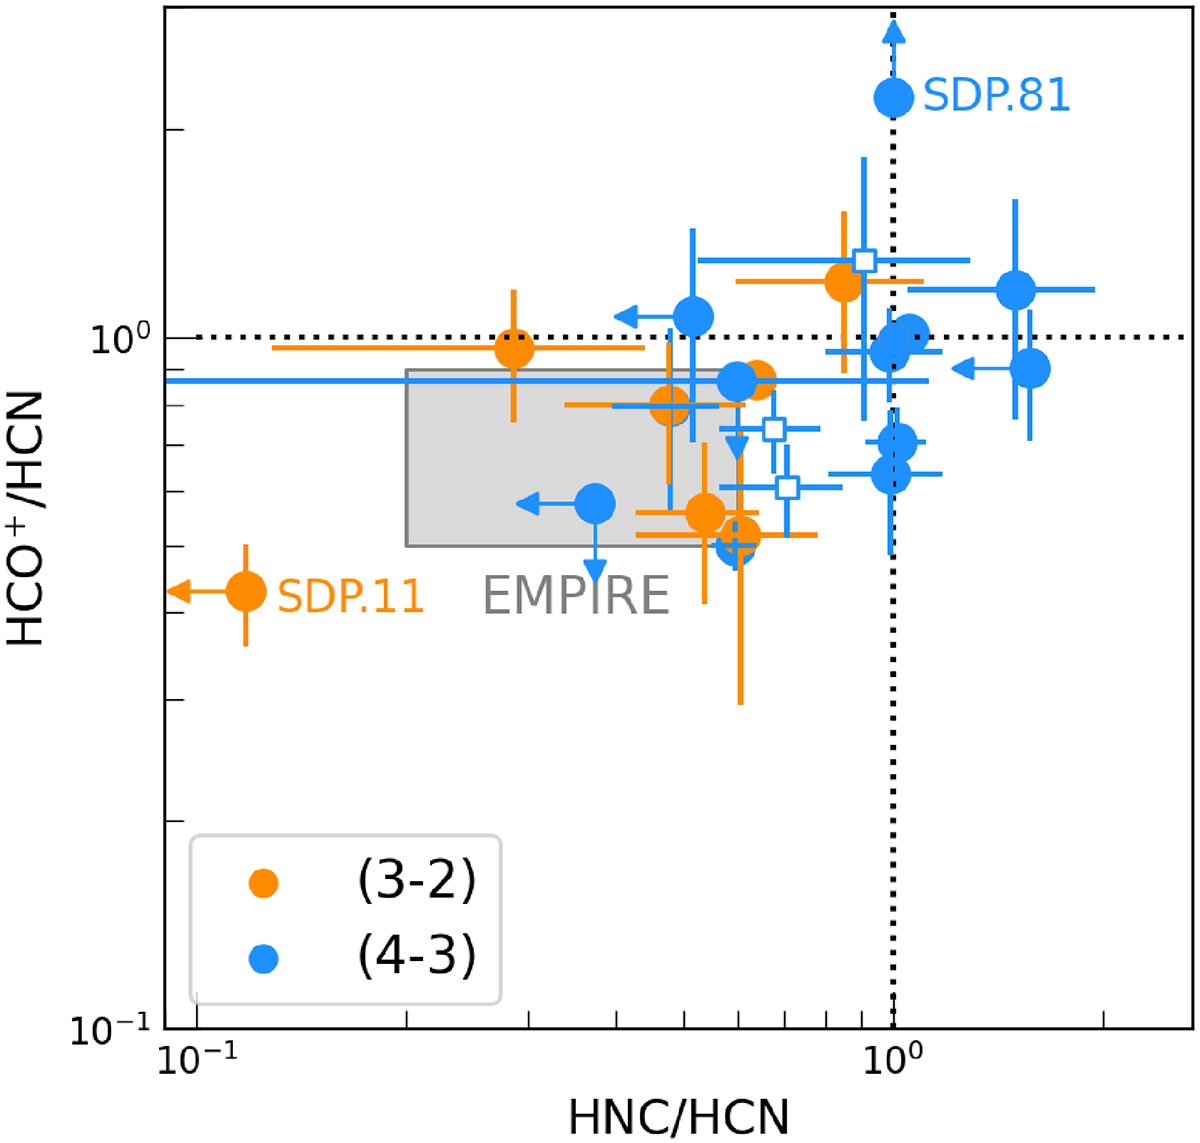
Fig. 4.
Download original image
HCO+/HCN and HNC/CO luminosity ratios in our sample (solid circles). We also include data from Yang et al. (2023) for comparison (empty squares). The shaded regions indicate HCO+/HCN and HNC/HNC ratios for the EMPIRE sample (Jiménez-Donaire et al. 2019). HCN is the brightest line in most of our targets. SDP.81 shows strong HCO+ enhancement, potentially due to low metallicity (Rybak et al. 2023). The HCN(3–2) emission line in SDP.11 is unusually bright, potentially due to AGN-driven chemistry.
Current usage metrics show cumulative count of Article Views (full-text article views including HTML views, PDF and ePub downloads, according to the available data) and Abstracts Views on Vision4Press platform.
Data correspond to usage on the plateform after 2015. The current usage metrics is available 48-96 hours after online publication and is updated daily on week days.
Initial download of the metrics may take a while.