Fig. 6.
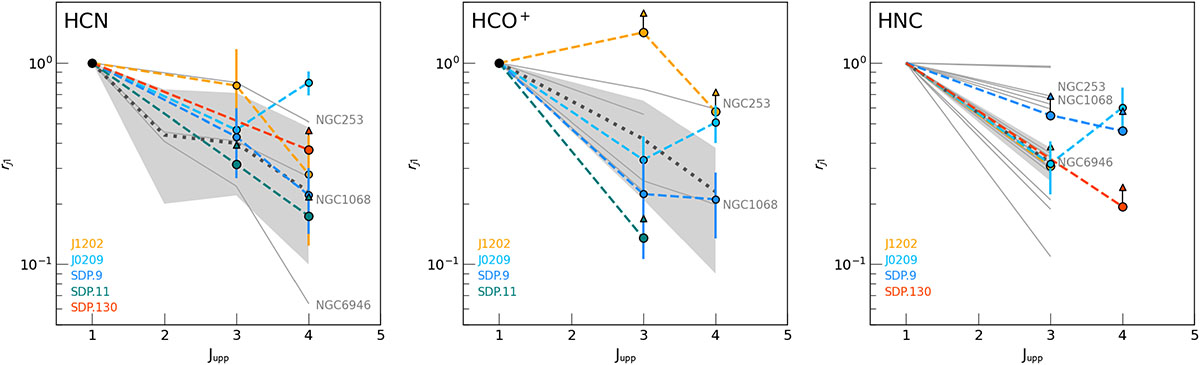
Download original image
Excitation coefficients of HCN, HCO+, and HNC in DSFGs from our sample (coloured), normalised to the (1−0) transition and compared to z ∼ 0 galaxies from the Israel (2023) compilation (grey). The arrows indicate the 3σ upper/lower limits. For comparison, we highlight SLEDs for nearby (U)LIRGs NGC 253, NGC 1068, and NGC 6946. In J0209 and J1202, the HCN and HCO+ SLEDs appear to be superthermalised. The sparseness of the HNC plot reflects the lack of detections at z ≈ 0.
Current usage metrics show cumulative count of Article Views (full-text article views including HTML views, PDF and ePub downloads, according to the available data) and Abstracts Views on Vision4Press platform.
Data correspond to usage on the plateform after 2015. The current usage metrics is available 48-96 hours after online publication and is updated daily on week days.
Initial download of the metrics may take a while.