Fig. 7
Download original image
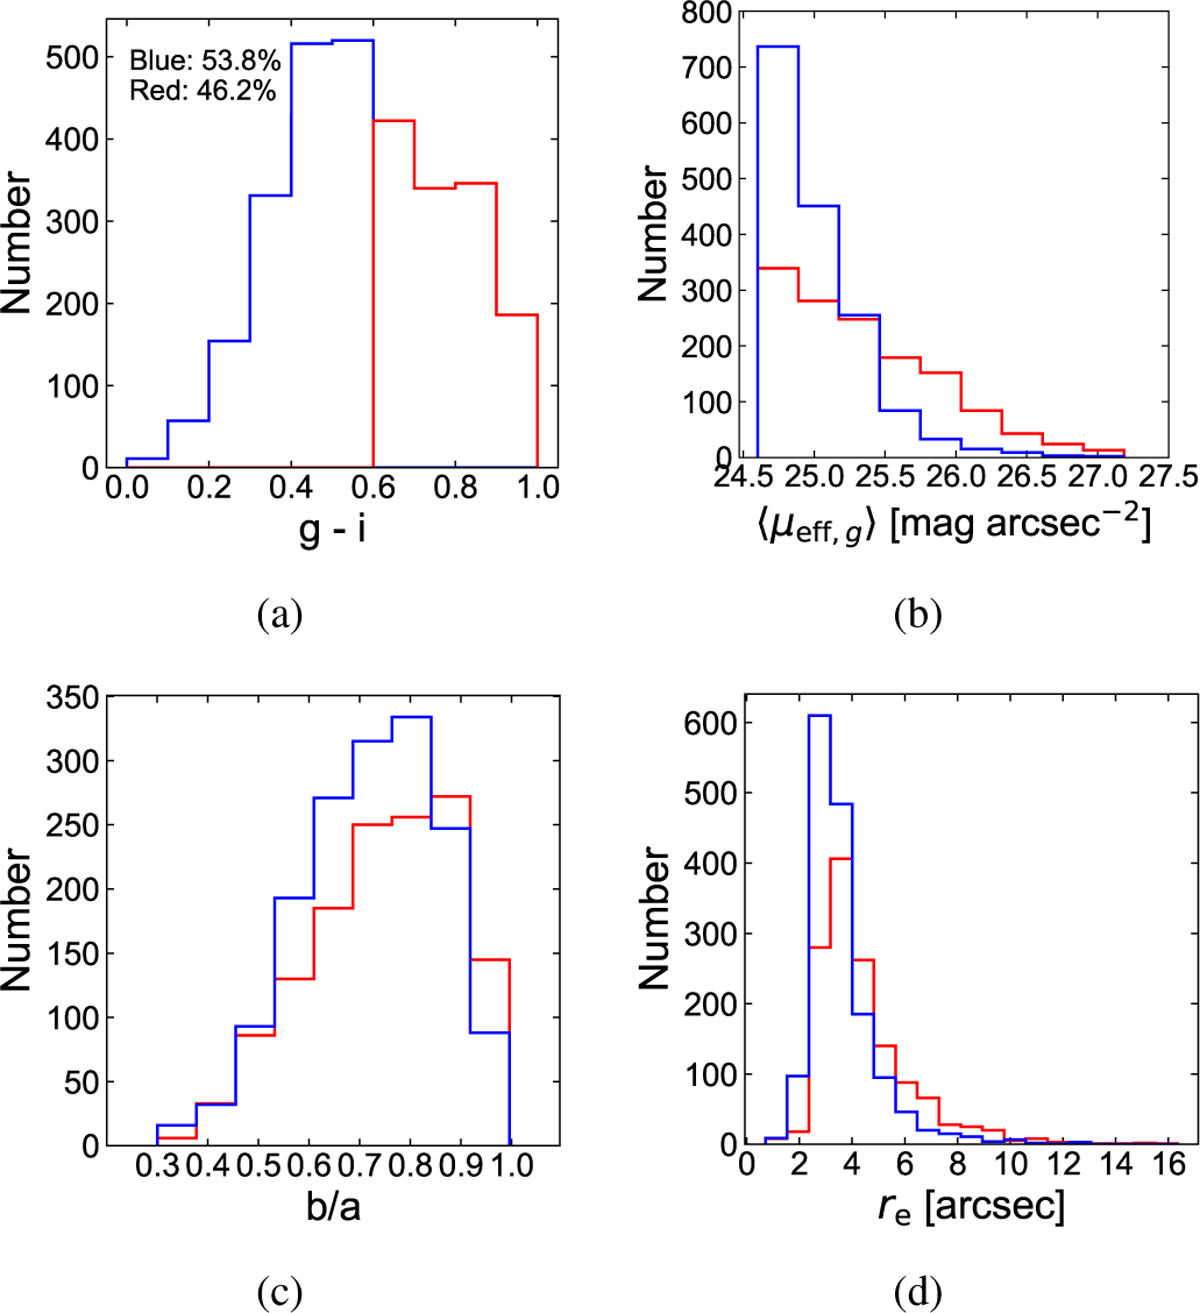
Distribution of structural parameters for 2952 UDG candidates: g-i color (panel a); average effective surface brightness (panel b); axis ratio (panel c); and effective radius (panel d). The blue histograms represent the distribution of blue candidates, while the red histograms represent the distribution of red candidates. The top left corner of panel a indicates the proportions of blue and red candidates.
Current usage metrics show cumulative count of Article Views (full-text article views including HTML views, PDF and ePub downloads, according to the available data) and Abstracts Views on Vision4Press platform.
Data correspond to usage on the plateform after 2015. The current usage metrics is available 48-96 hours after online publication and is updated daily on week days.
Initial download of the metrics may take a while.