Open Access
Fig. 8
Download original image
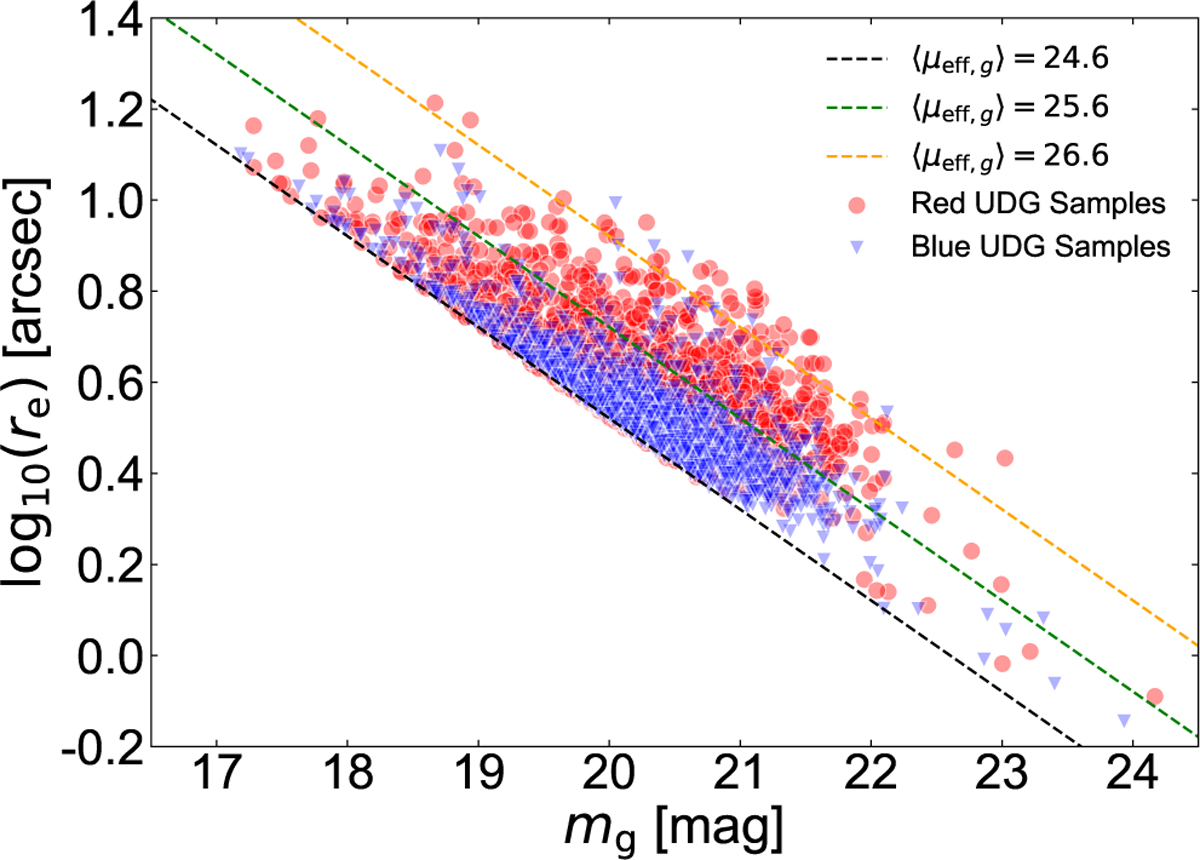
Radius-magnitude diagram for all UDG samples(2991 in total). Red UDG samples are represented by red circles, and blue UDG samples are represented by blue triangles. The dashed line corresponds to the average effective surface brightness in the g band.
Current usage metrics show cumulative count of Article Views (full-text article views including HTML views, PDF and ePub downloads, according to the available data) and Abstracts Views on Vision4Press platform.
Data correspond to usage on the plateform after 2015. The current usage metrics is available 48-96 hours after online publication and is updated daily on week days.
Initial download of the metrics may take a while.