Fig. 9
Download original image
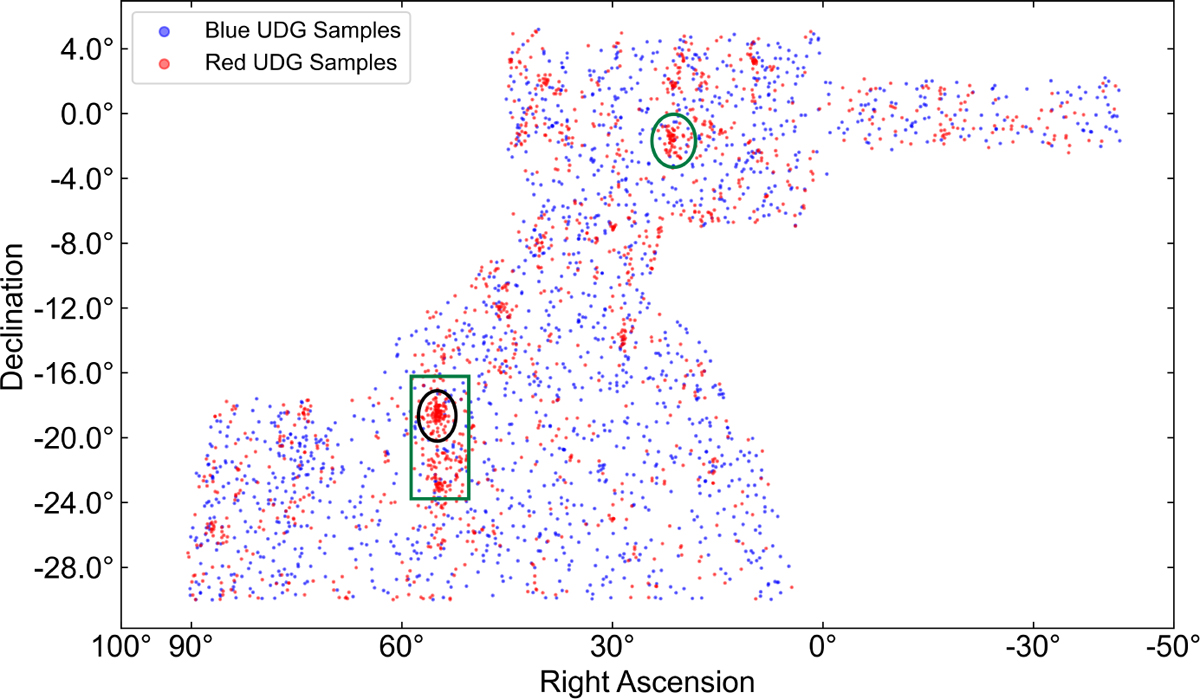
Sky distribution of red UDG samples (red dots) and blue UDG samples (blue dots) identified in this study (2991 in total). The green circle marks the location of the Abell 194 galaxy cluster (RA=21.4200°, Dec=−1.4072°), and the black circle marks the location of the RXC J0340.1-1835 galaxy cluster (RA =55.0475°, Dec =−18.5875°). The green box highlights the region where red UDG samples show a significant clustering feature, with Dec values between −24° and −16°.
Current usage metrics show cumulative count of Article Views (full-text article views including HTML views, PDF and ePub downloads, according to the available data) and Abstracts Views on Vision4Press platform.
Data correspond to usage on the plateform after 2015. The current usage metrics is available 48-96 hours after online publication and is updated daily on week days.
Initial download of the metrics may take a while.