Fig. 1
Download original image
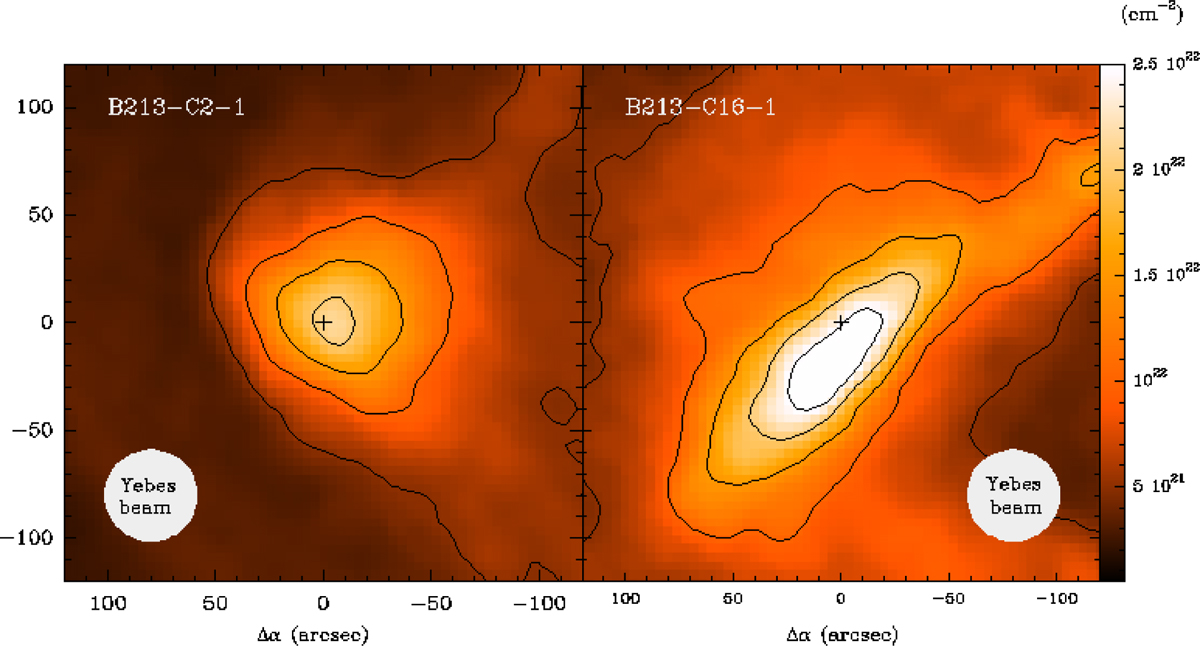
B213-C2 and B213-C16 molecular hydrogen column density maps derived by Palmeirim et al. (2013), reconstructed at an angular resolution of 18.2″. Contour levels are (5,10,15 and 20) × 1021 cm−2 in the left panel and (5,10,15,20 and 25) × 1021 cm−2 in the right panel. The beam of the Yebes telescope in the Q band (HPBW≈42.5″) is plotted in each panel.
Current usage metrics show cumulative count of Article Views (full-text article views including HTML views, PDF and ePub downloads, according to the available data) and Abstracts Views on Vision4Press platform.
Data correspond to usage on the plateform after 2015. The current usage metrics is available 48-96 hours after online publication and is updated daily on week days.
Initial download of the metrics may take a while.