Fig. 5
Download original image
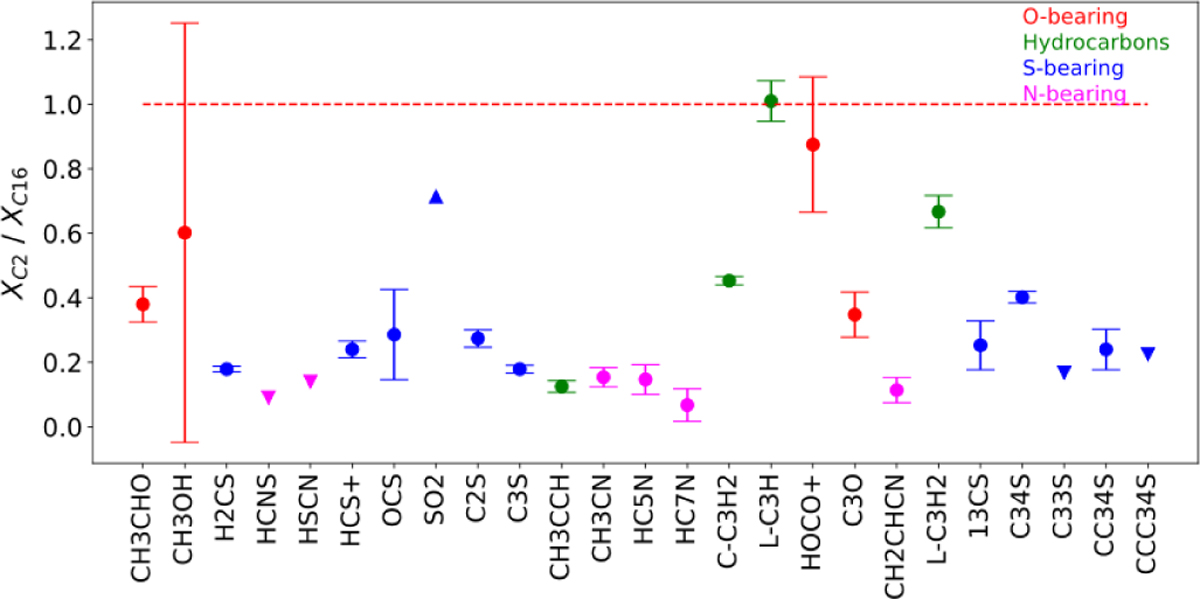
Fractional abundance ratios between B213-C2 and B213-C16, for all the detected species. Lower limits of the ratios, corresponding to molecules detected in B213-C16 but not in B213-C2, are marked with downward triangles. Conversely, upper limits of the ratios, for molecules detected in B213-C2 but not in B213-C16, are indicated with upward triangles.
Current usage metrics show cumulative count of Article Views (full-text article views including HTML views, PDF and ePub downloads, according to the available data) and Abstracts Views on Vision4Press platform.
Data correspond to usage on the plateform after 2015. The current usage metrics is available 48-96 hours after online publication and is updated daily on week days.
Initial download of the metrics may take a while.