Open Access
Fig. 9
Download original image
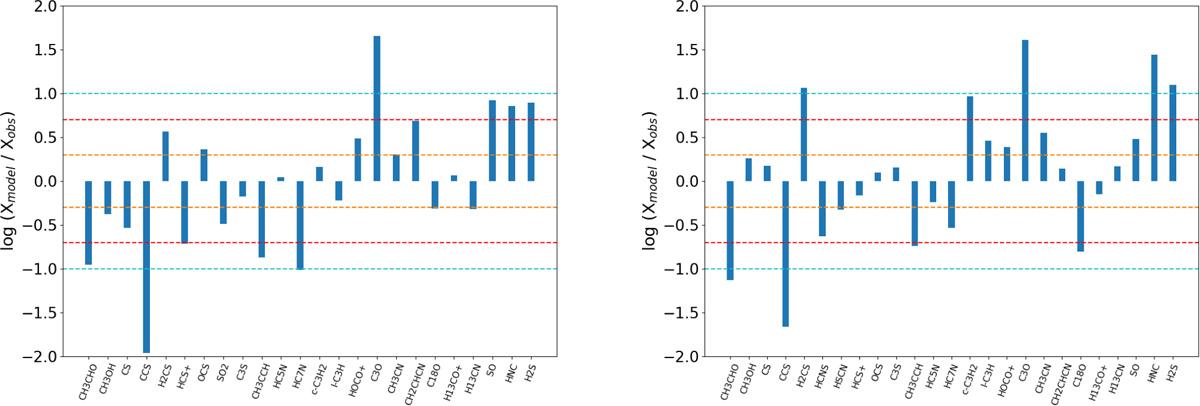
Ratios between the best-fitting model prediction and the observed abundances for B213-C2 (left) and B213-C16 (right), indicated with blue bars. Discrepancies between model and observations of a factor 10, 5 and 2 are indicated with dashed blue, red, and orange lines, respectively.
Current usage metrics show cumulative count of Article Views (full-text article views including HTML views, PDF and ePub downloads, according to the available data) and Abstracts Views on Vision4Press platform.
Data correspond to usage on the plateform after 2015. The current usage metrics is available 48-96 hours after online publication and is updated daily on week days.
Initial download of the metrics may take a while.