Open Access
Fig. 5.
Download original image
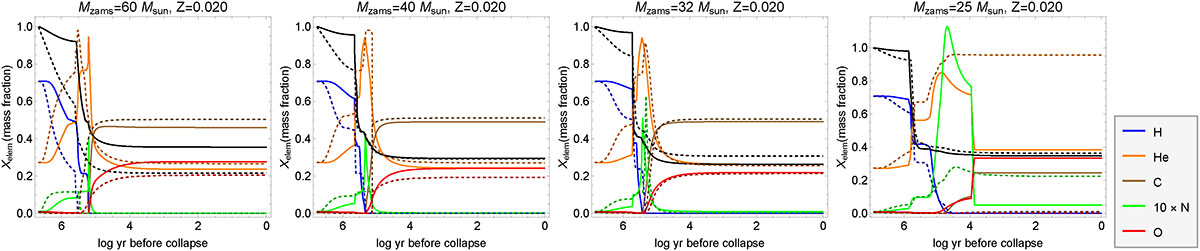
Evolution of the surface abundances for hydrogen, helium, carbon, nitrogen, and oxygen for the models that reach the WR phase. The black lines represent the total mass fraction, M*/Mzams. The nitrogen abundance is multiplied by 10 for illustrative purposes.
Current usage metrics show cumulative count of Article Views (full-text article views including HTML views, PDF and ePub downloads, according to the available data) and Abstracts Views on Vision4Press platform.
Data correspond to usage on the plateform after 2015. The current usage metrics is available 48-96 hours after online publication and is updated daily on week days.
Initial download of the metrics may take a while.