Fig. 6.
Download original image
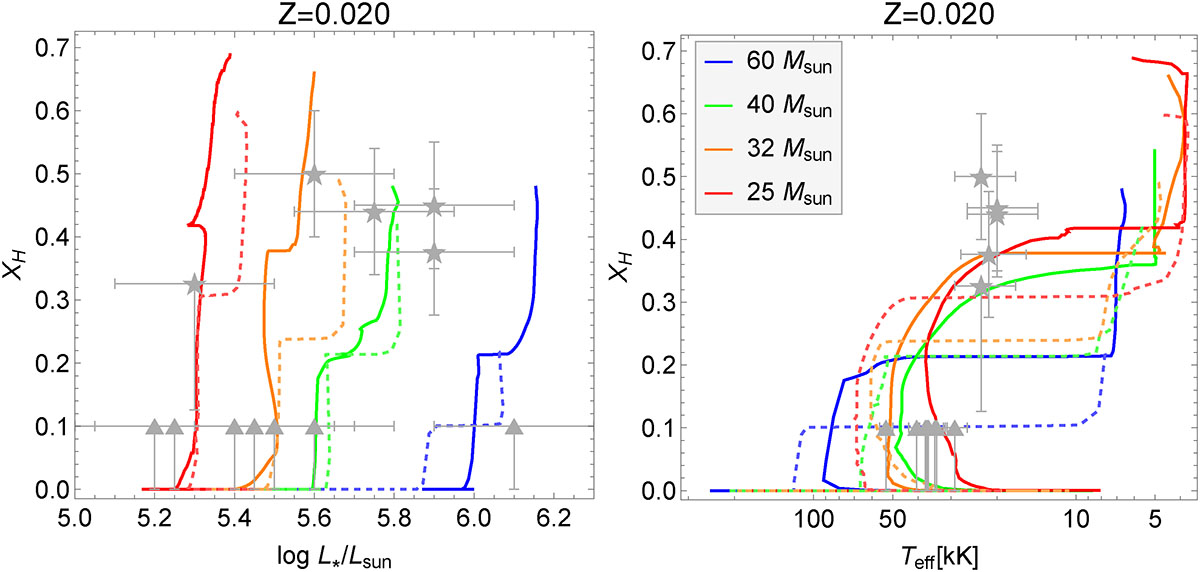
Left panel: Hydrogen mass fraction at the stellar surface as a function of the stellar luminosity from the H-core ignition to the C-core depletion. Right panel: Hydrogen mass fraction at the stellar surface as a function of the stellar temperature from He ignition to the C-core depletion. The grey stars and triangles represent the observational values calculated by Martins et al. (2007) for Ofpe/WN9 and WN stars, respectively. The solid and dashed lines represent new and old models, respectively, as in Fig. 1.
Current usage metrics show cumulative count of Article Views (full-text article views including HTML views, PDF and ePub downloads, according to the available data) and Abstracts Views on Vision4Press platform.
Data correspond to usage on the plateform after 2015. The current usage metrics is available 48-96 hours after online publication and is updated daily on week days.
Initial download of the metrics may take a while.