Open Access
Fig. 9.
Download original image
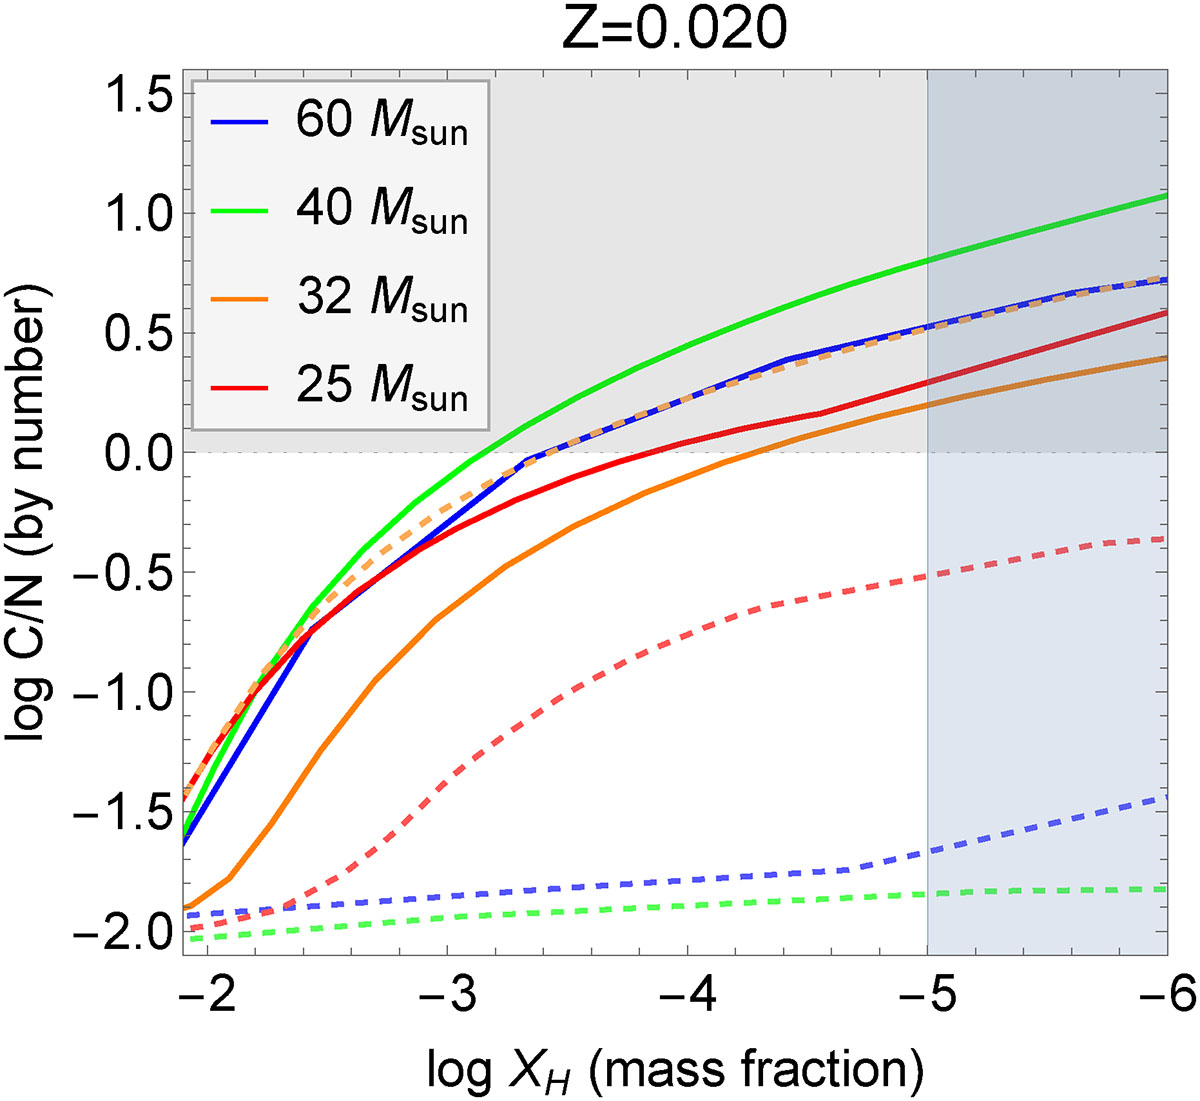
Evolution of the C/N ratio in the evolution models as the stars loose their last 1% of hydrogen in the outer layer. The blue shaded region represents XH ≤ 10−5 and XC ≥ XN, and the grey shaded region shows XH ≥ 10−5 and XC ≤ XN. The solid and dashed lines represent the new and old models, respectively, as in Fig. 1.
Current usage metrics show cumulative count of Article Views (full-text article views including HTML views, PDF and ePub downloads, according to the available data) and Abstracts Views on Vision4Press platform.
Data correspond to usage on the plateform after 2015. The current usage metrics is available 48-96 hours after online publication and is updated daily on week days.
Initial download of the metrics may take a while.