Open Access
Fig. 1
Download original image
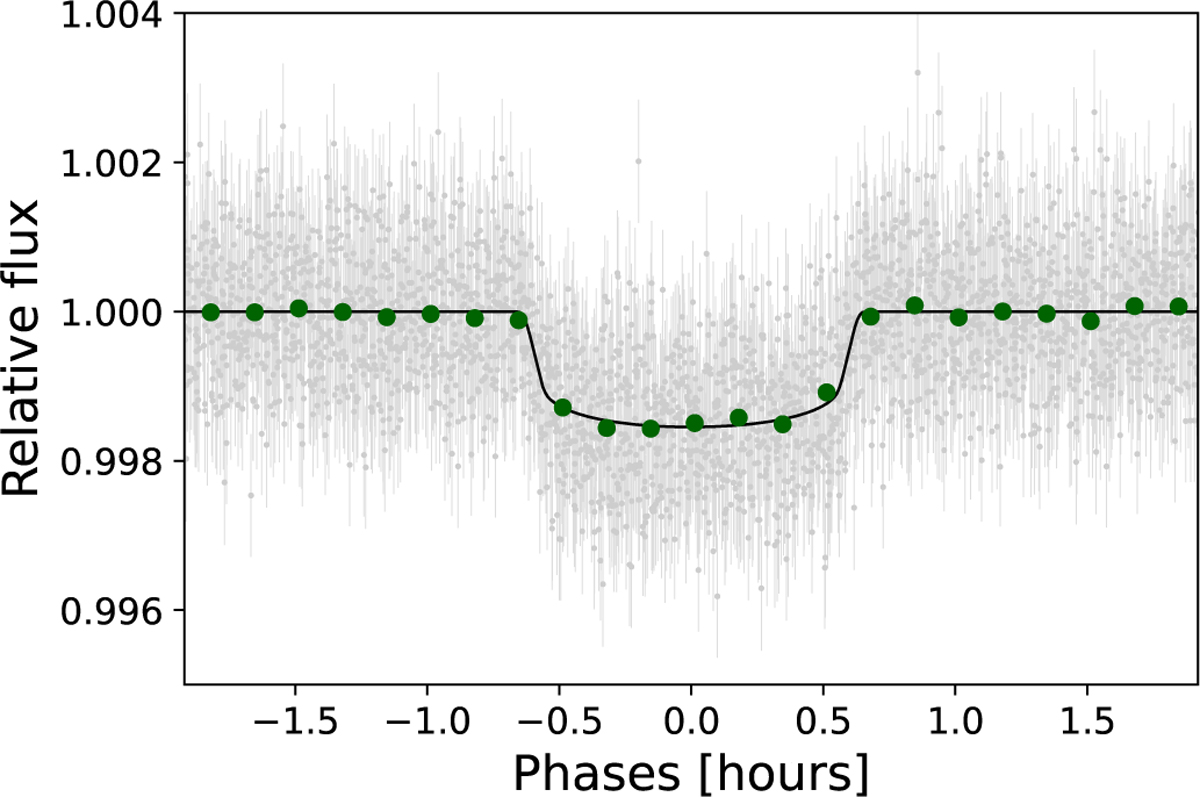
Phase-folded TESS light curves of GJ 3090 b (grey points). The dark green circles are data binned to 10 min. The black lines represent the median model of each sector from the fit.
Current usage metrics show cumulative count of Article Views (full-text article views including HTML views, PDF and ePub downloads, according to the available data) and Abstracts Views on Vision4Press platform.
Data correspond to usage on the plateform after 2015. The current usage metrics is available 48-96 hours after online publication and is updated daily on week days.
Initial download of the metrics may take a while.