Fig. 10
Download original image
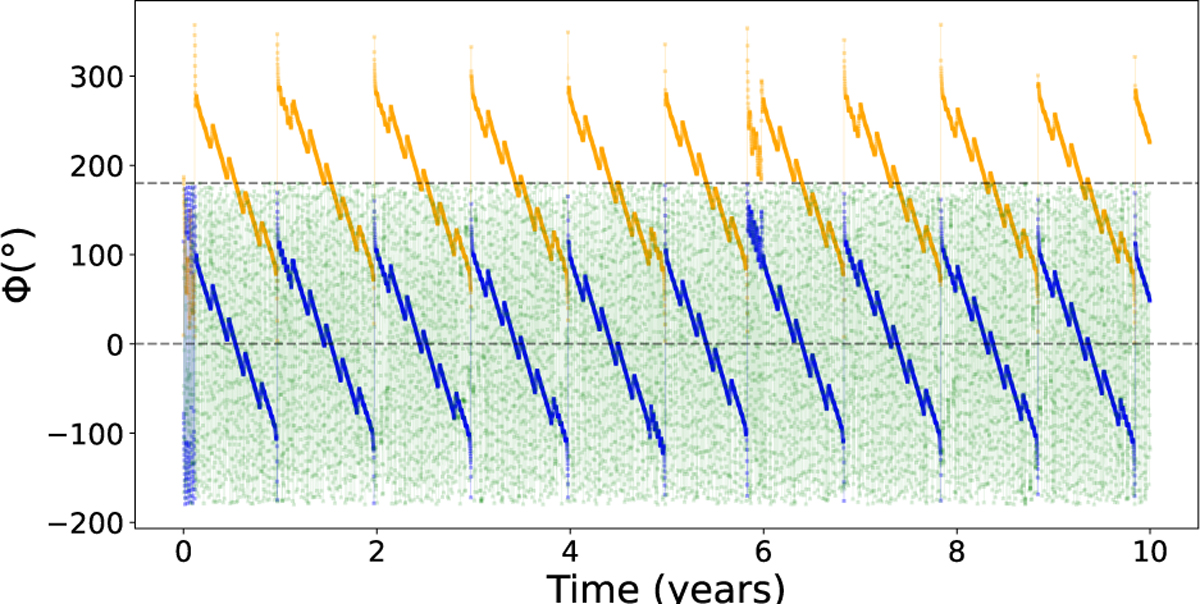
Plot of samples of φ1 (orange), φ2 (blue), and φ12 (green) between GJ 3090 c and the 12.7-day candidate. Samples are taken 1000 times a year, across the first 10 years of a 1 Myr integration of the GJ 3090 system. Horizontal dashed lines corresponding to 0° and 180° are shown as well. While Figure 9 appears to show all three angles librating, the higher sampling frequency shown here shows that all three angles circulate.
Current usage metrics show cumulative count of Article Views (full-text article views including HTML views, PDF and ePub downloads, according to the available data) and Abstracts Views on Vision4Press platform.
Data correspond to usage on the plateform after 2015. The current usage metrics is available 48-96 hours after online publication and is updated daily on week days.
Initial download of the metrics may take a while.