Fig. A.2
Download original image
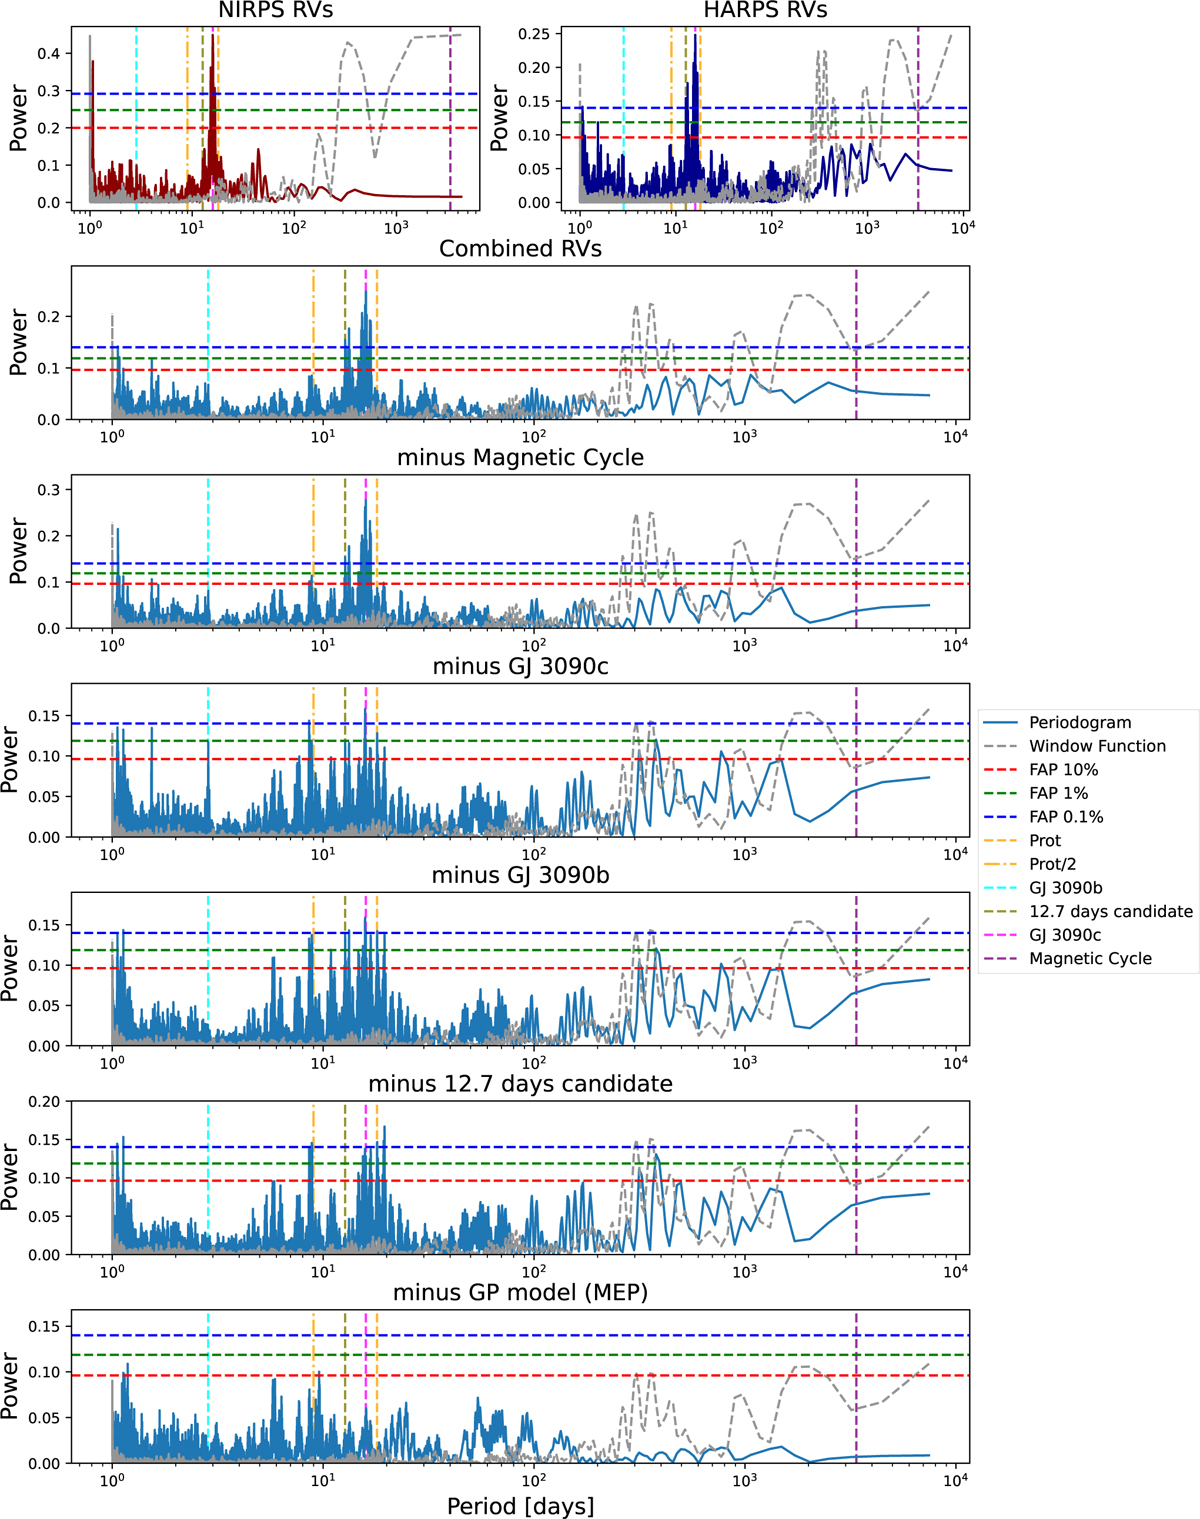
Periodograms of the RVs after having subtracted the best-fit offset of each instrument. The first panel shows the periodogram of the RVs of NIRPS and HARPS (HAM & EGGS) separately. The second panel shows the periodogram of the combined RVs, with significant peaks marked for known planets and signals. The subsequent panels show the periodograms after sequentially removing the signals of the magnetic cycle, GJ 3090c, GJ 3090b, the 12.7-day candidate, and finally the GP model. Analytical false alarm probability (FAP) levels of 10%, 1%, and 0.1% are indicated by dashed lines in red, green, and blue, respectively. The window function is shown as a grey dashed line.
Current usage metrics show cumulative count of Article Views (full-text article views including HTML views, PDF and ePub downloads, according to the available data) and Abstracts Views on Vision4Press platform.
Data correspond to usage on the plateform after 2015. The current usage metrics is available 48-96 hours after online publication and is updated daily on week days.
Initial download of the metrics may take a while.