Fig. A.3
Download original image
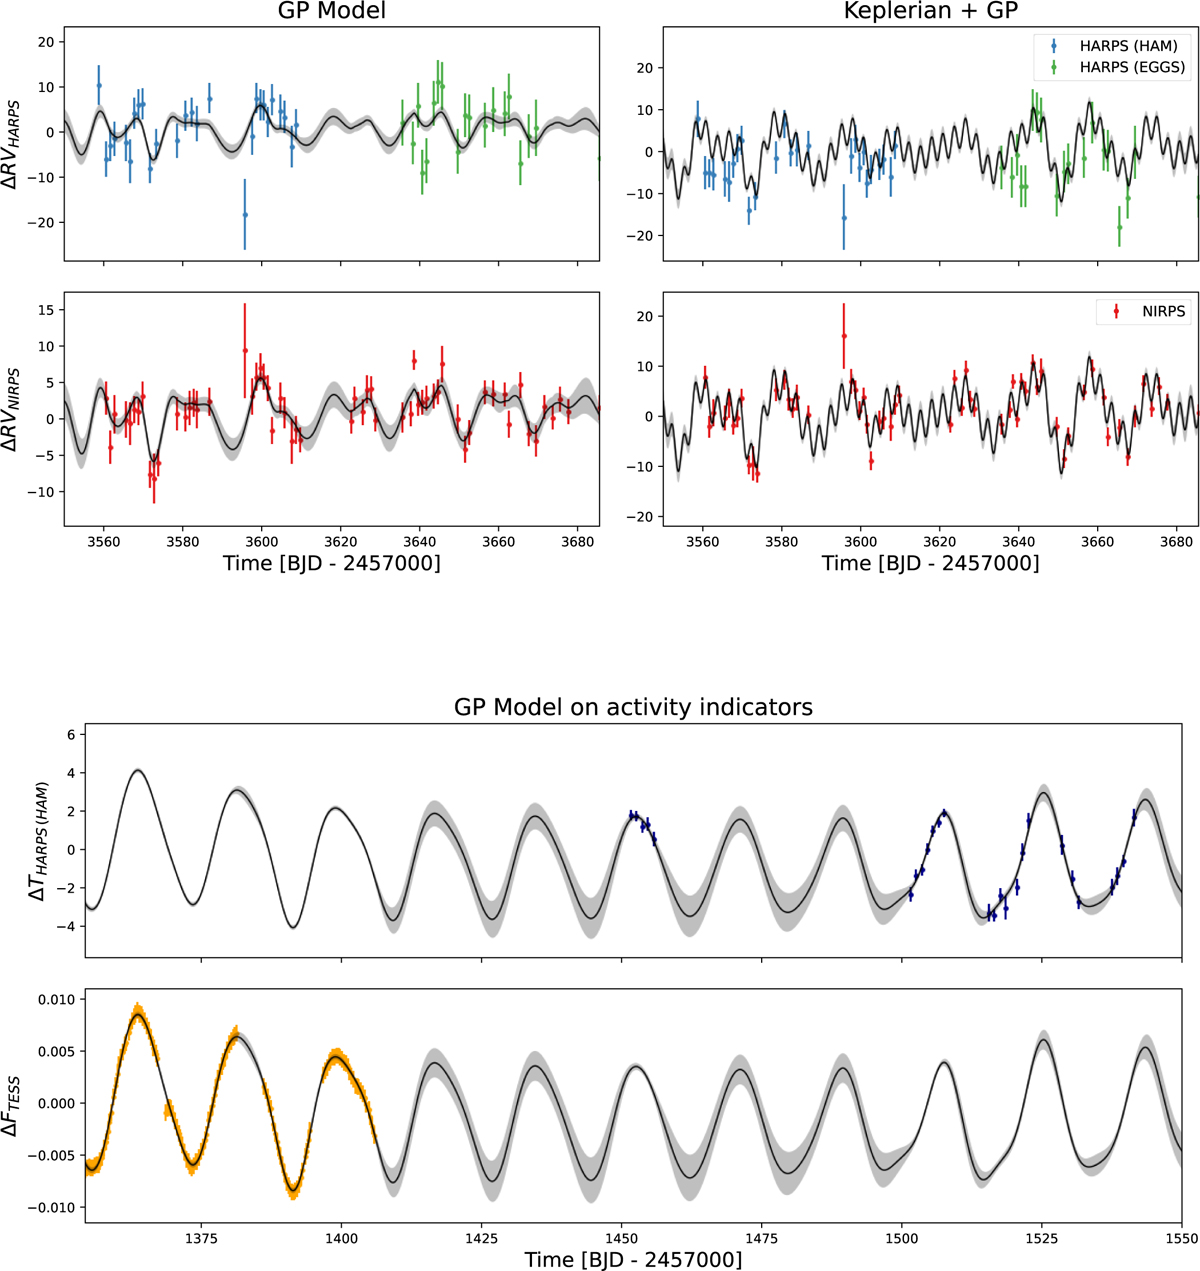
Top panel: Subsets of the RV time series for HARPS and NIRPS. The left sub-panel shows the GP model fit to the RV data without the Keplerian signals, while the right sub-panel presents the combined Keplerian and GP model. Bottom panel: GP model applied to the activity indicators, specifically the ΔT and TESS data. The shaded regions represent the 1σ confidence intervals of the GP model predictions. We note that the top and bottom panels do not show the same epochs of observation. The top panel shows 135 days of data before the last spectrum and the bottom panel shows up to 195 days after the beginning of first TESS sector.
Current usage metrics show cumulative count of Article Views (full-text article views including HTML views, PDF and ePub downloads, according to the available data) and Abstracts Views on Vision4Press platform.
Data correspond to usage on the plateform after 2015. The current usage metrics is available 48-96 hours after online publication and is updated daily on week days.
Initial download of the metrics may take a while.