Fig. A.4
Download original image
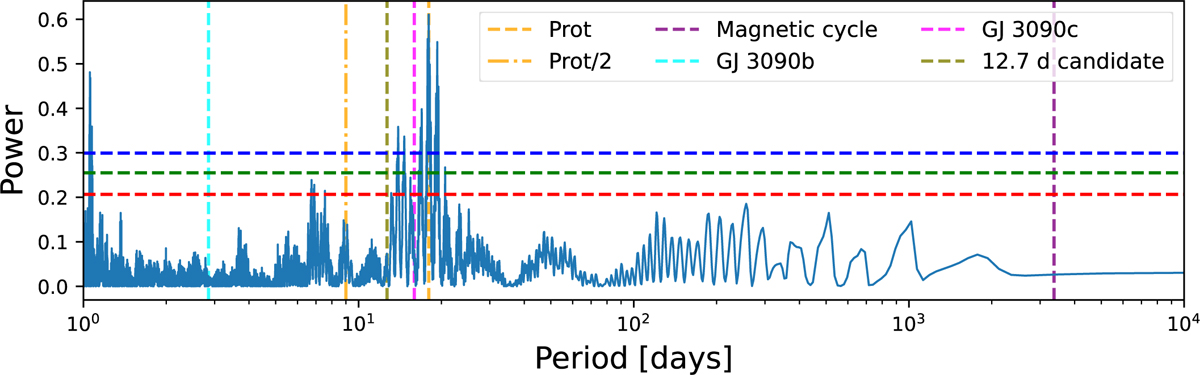
Lomb-Scargle periodogram of the HARPS (HAM) ΔT measurements. The solid blue line shows the power as a function of period, while the horizontal red, green, and blue dashed lines mark the 1%, 0.1%, and 0.01% analytical false alarm probability thresholds respectively. There are no significant peaks around the planets’ periods. There is a forest of statistically significant peaks between 13 and 20 days which shows a sign of potential differential rotation.
Current usage metrics show cumulative count of Article Views (full-text article views including HTML views, PDF and ePub downloads, according to the available data) and Abstracts Views on Vision4Press platform.
Data correspond to usage on the plateform after 2015. The current usage metrics is available 48-96 hours after online publication and is updated daily on week days.
Initial download of the metrics may take a while.