Fig. A.5
Download original image
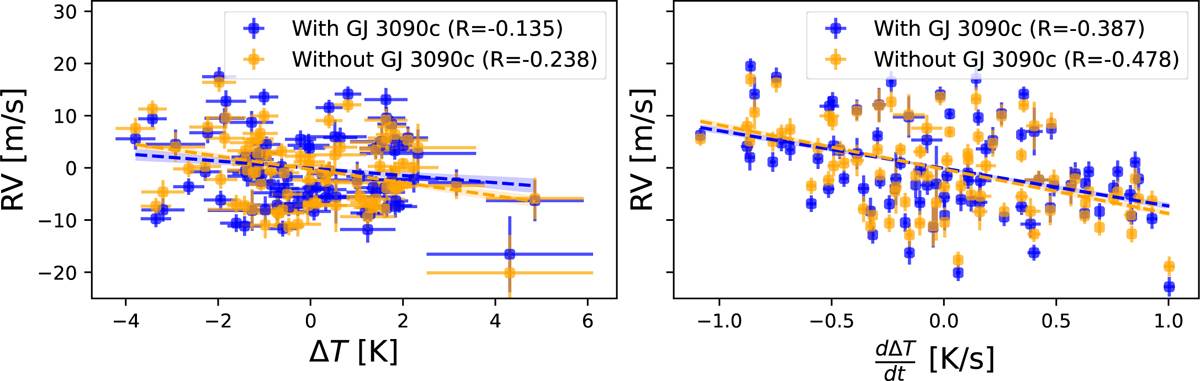
Correlations between HARPS (HAM) RVs and its ΔT indicator (left) and with the d ΔT/d t (right). The blue data points show the RVs that include the 16-day signal and the orange data points show the RVs after removing the best-fit Keplerian model of the 16-day signal. A linear function is fitted in each dataset. First-order correlation (top): R=−0.135 to R=−0.238 and Nσ=2.71 to Nσ=6.73. Second-order correlation (bottom): R=−0.386 to R=−0.479 and Nσ=17.2 to Nσ=20.6
Current usage metrics show cumulative count of Article Views (full-text article views including HTML views, PDF and ePub downloads, according to the available data) and Abstracts Views on Vision4Press platform.
Data correspond to usage on the plateform after 2015. The current usage metrics is available 48-96 hours after online publication and is updated daily on week days.
Initial download of the metrics may take a while.