Fig. A.6
Download original image
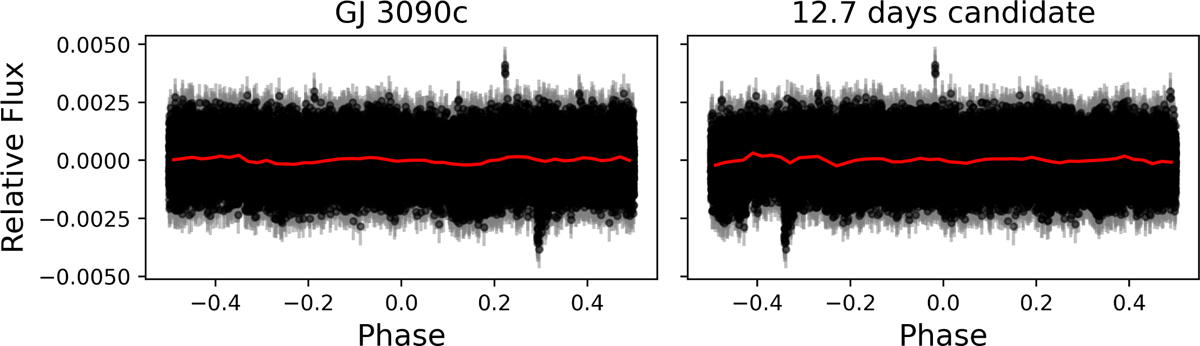
Phase-folded light curves for the two outer planets. The left panel shows the light curve for GJ 3090 c, while the right panel corresponds to the 12.7-day candidate. The data points represent the TESS photometry corrected with the activity model. The red line is a binned version of the data (50 points per bin) so that we see the flux variations more easily. No transit is observed in either case.
Current usage metrics show cumulative count of Article Views (full-text article views including HTML views, PDF and ePub downloads, according to the available data) and Abstracts Views on Vision4Press platform.
Data correspond to usage on the plateform after 2015. The current usage metrics is available 48-96 hours after online publication and is updated daily on week days.
Initial download of the metrics may take a while.