Fig. 2
Download original image
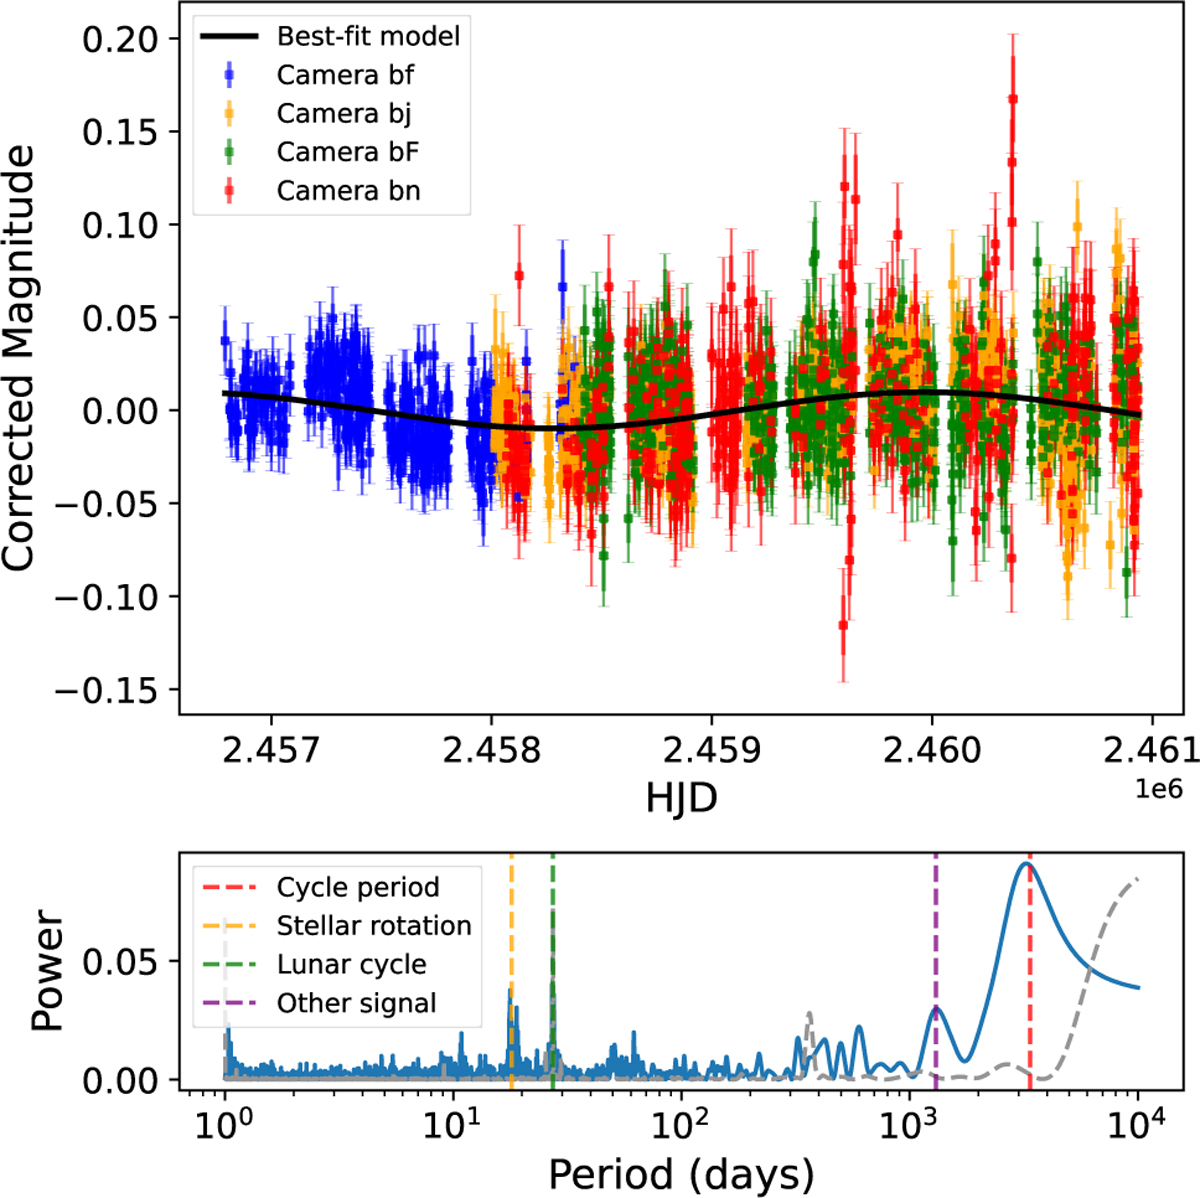
Top panel: joint best-fit sinusoidal model to the ASAS-SN photometric data from all available cameras (bf, bj, bF, and bn). The solid lines represent the best-fit model. Bottom panel: Lomb-Scargle periodogram of the ASAS-SN photometry after camera offset corrections. The blue curve shows the power spectrum. The strongest peak corresponds to the best-fit magnetic cycle period of 3370 ± 120 days (red dashed line), while the orange dashed line indicates the stellar rotation period of 18.0 days and the green dashed line shows the sidereal lunar cycle that arises from the applied lunar correction. The grey dashed curve represents the window function.
Current usage metrics show cumulative count of Article Views (full-text article views including HTML views, PDF and ePub downloads, according to the available data) and Abstracts Views on Vision4Press platform.
Data correspond to usage on the plateform after 2015. The current usage metrics is available 48-96 hours after online publication and is updated daily on week days.
Initial download of the metrics may take a while.