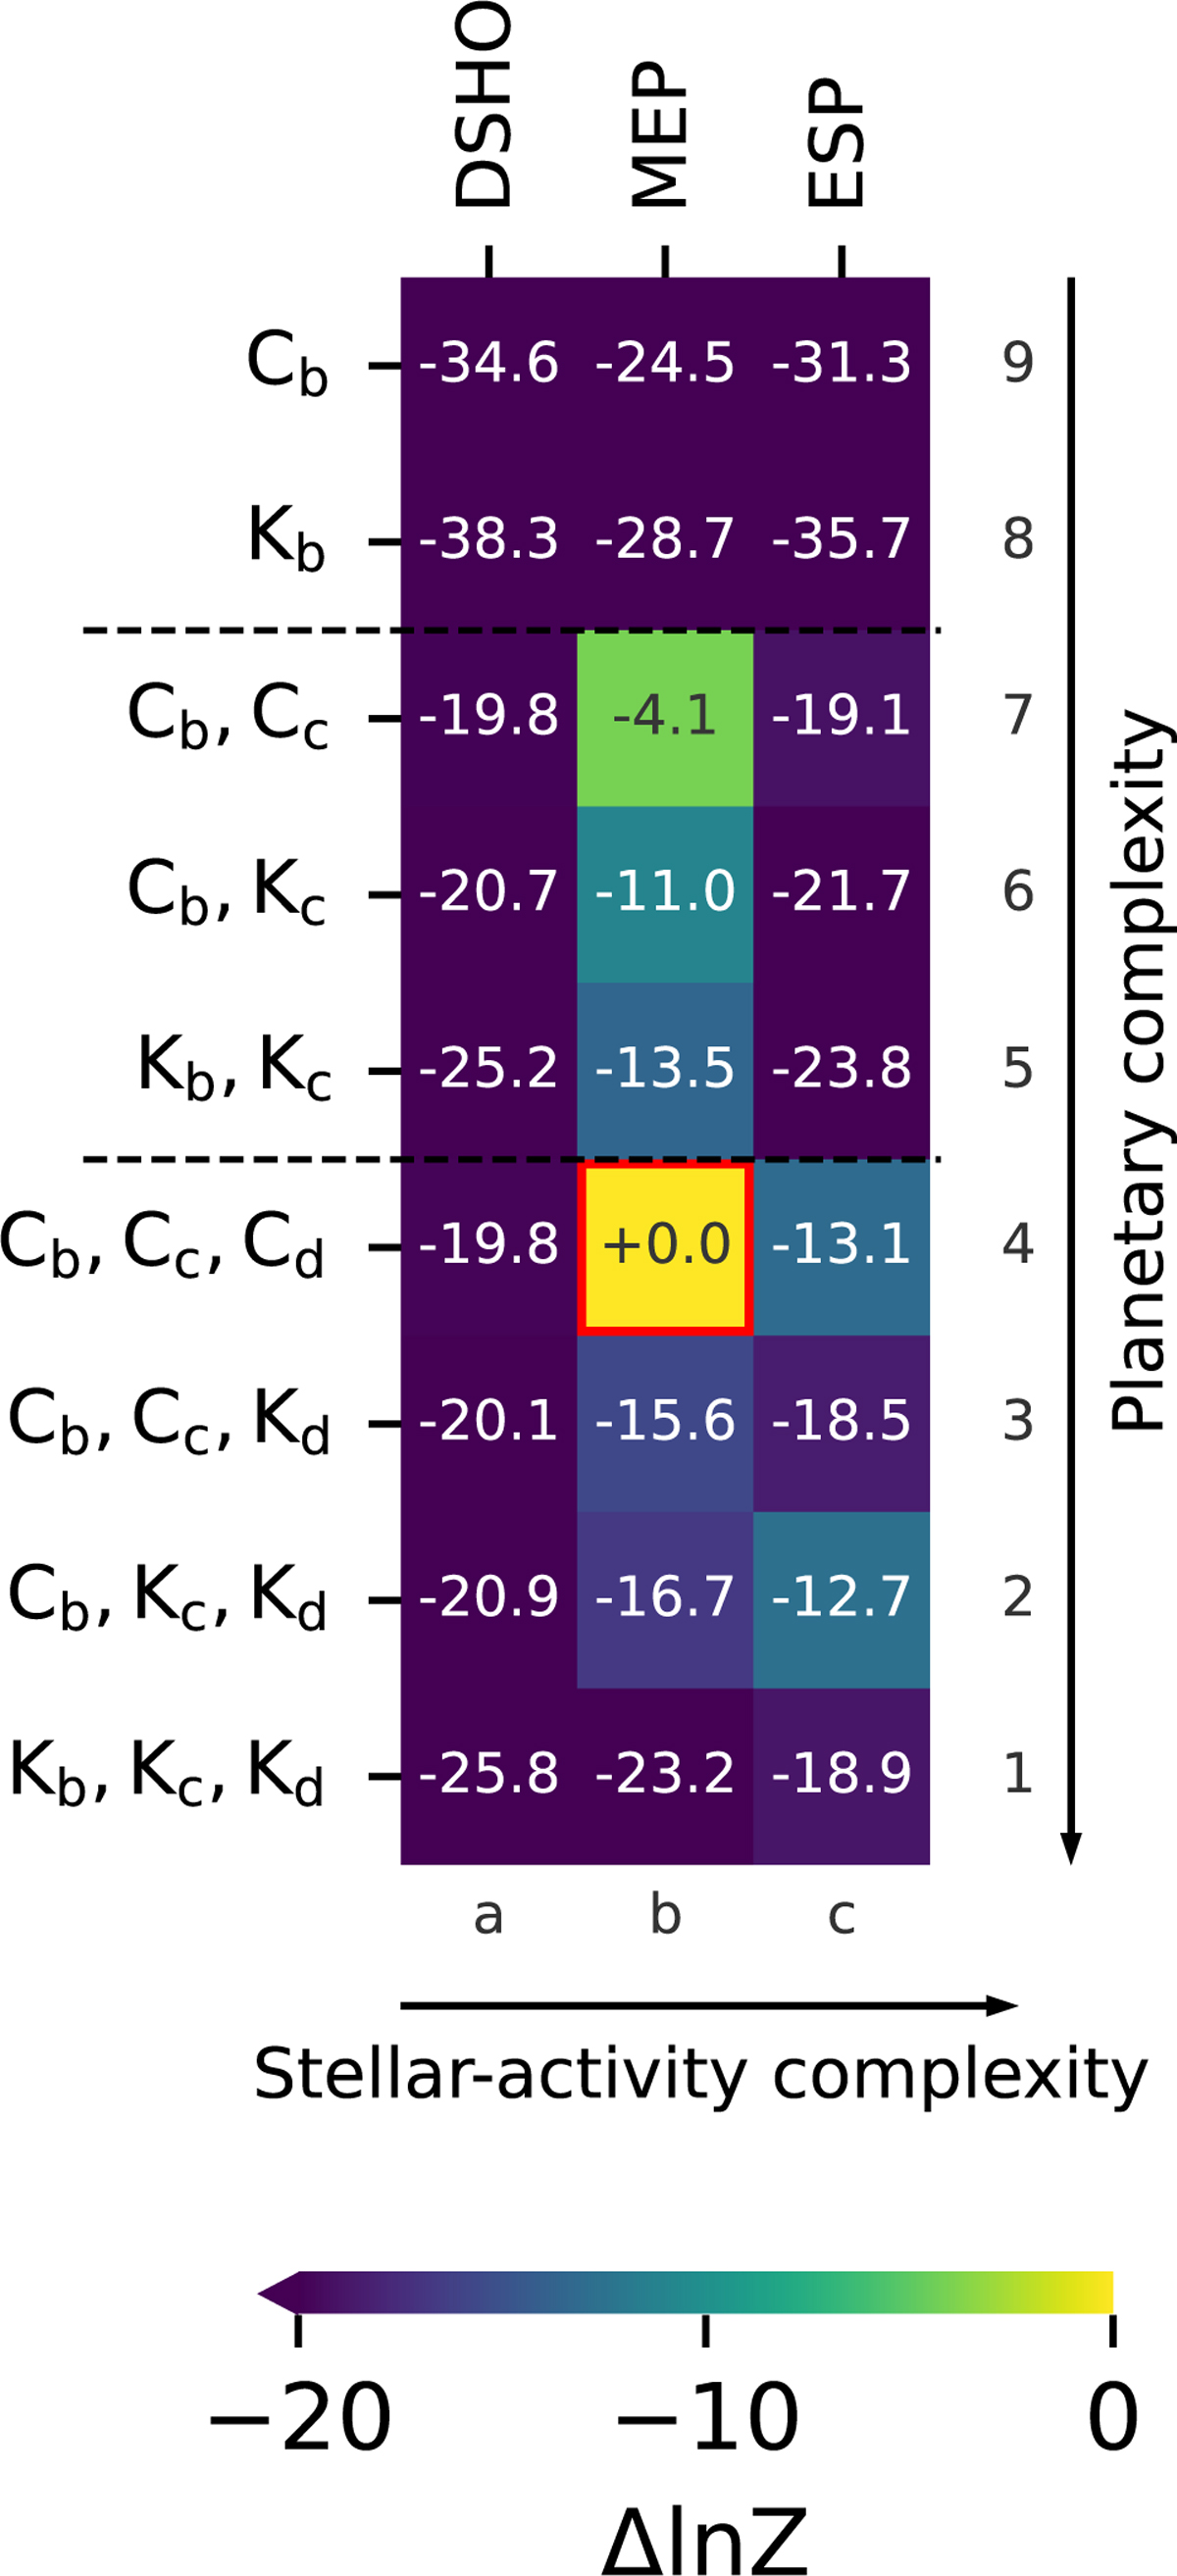
Fig. 4
Download original image
Heat map similar to that in S25 showing the comparison of Bayesian evidence (Δ ln Z) for different models. The x-axis displays different stellar-activity kernels in increasing order of complexity, while the y-axis shows different planetary configurations. Circular orbits (e= 0) are labelled ‘C’, while Keplerian orbits (e ≥ 0) are labelled ‘K’. The red rectangle highlights the best model based on the maximum Bayesian evidence.
Current usage metrics show cumulative count of Article Views (full-text article views including HTML views, PDF and ePub downloads, according to the available data) and Abstracts Views on Vision4Press platform.
Data correspond to usage on the plateform after 2015. The current usage metrics is available 48-96 hours after online publication and is updated daily on week days.
Initial download of the metrics may take a while.