Fig. 7
Download original image
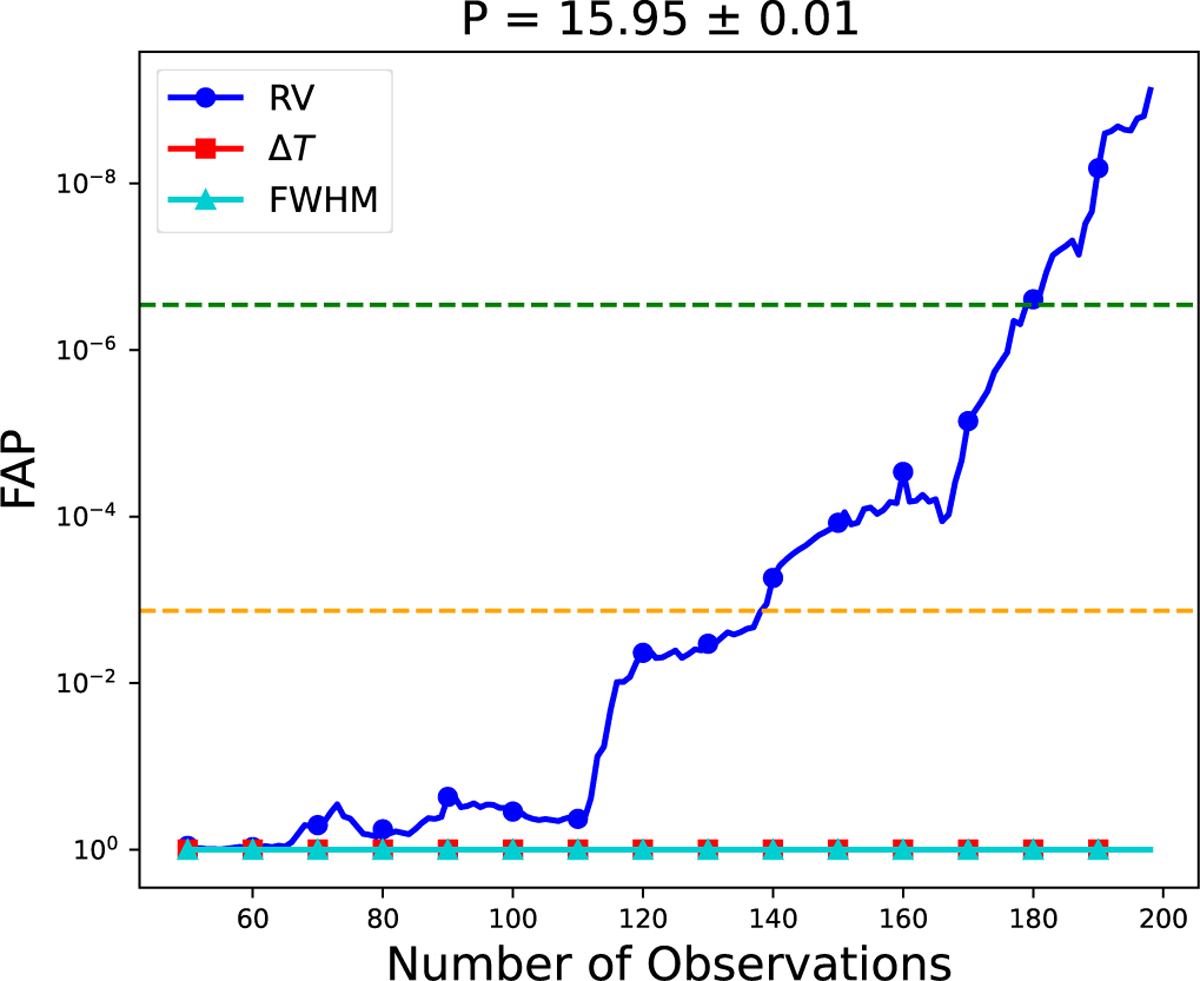
Chronological evolution of the false alarm probability (FAP) for the 16-day signal. As new observations are added, the FAP in the RVs decreases steadily, consistent with a stable Keplerian signal. In contrast, the FAP in the ΔT and FWHM activity indicators remains high across the datasets. The orange and green horizontal lines represent the 3σ and 5σ detection significance respectively. This behaviour supports the long-term coherence of the GJ 3090 c signal and disfavours a stellar origin.
Current usage metrics show cumulative count of Article Views (full-text article views including HTML views, PDF and ePub downloads, according to the available data) and Abstracts Views on Vision4Press platform.
Data correspond to usage on the plateform after 2015. The current usage metrics is available 48-96 hours after online publication and is updated daily on week days.
Initial download of the metrics may take a while.