Fig. 1
Download original image
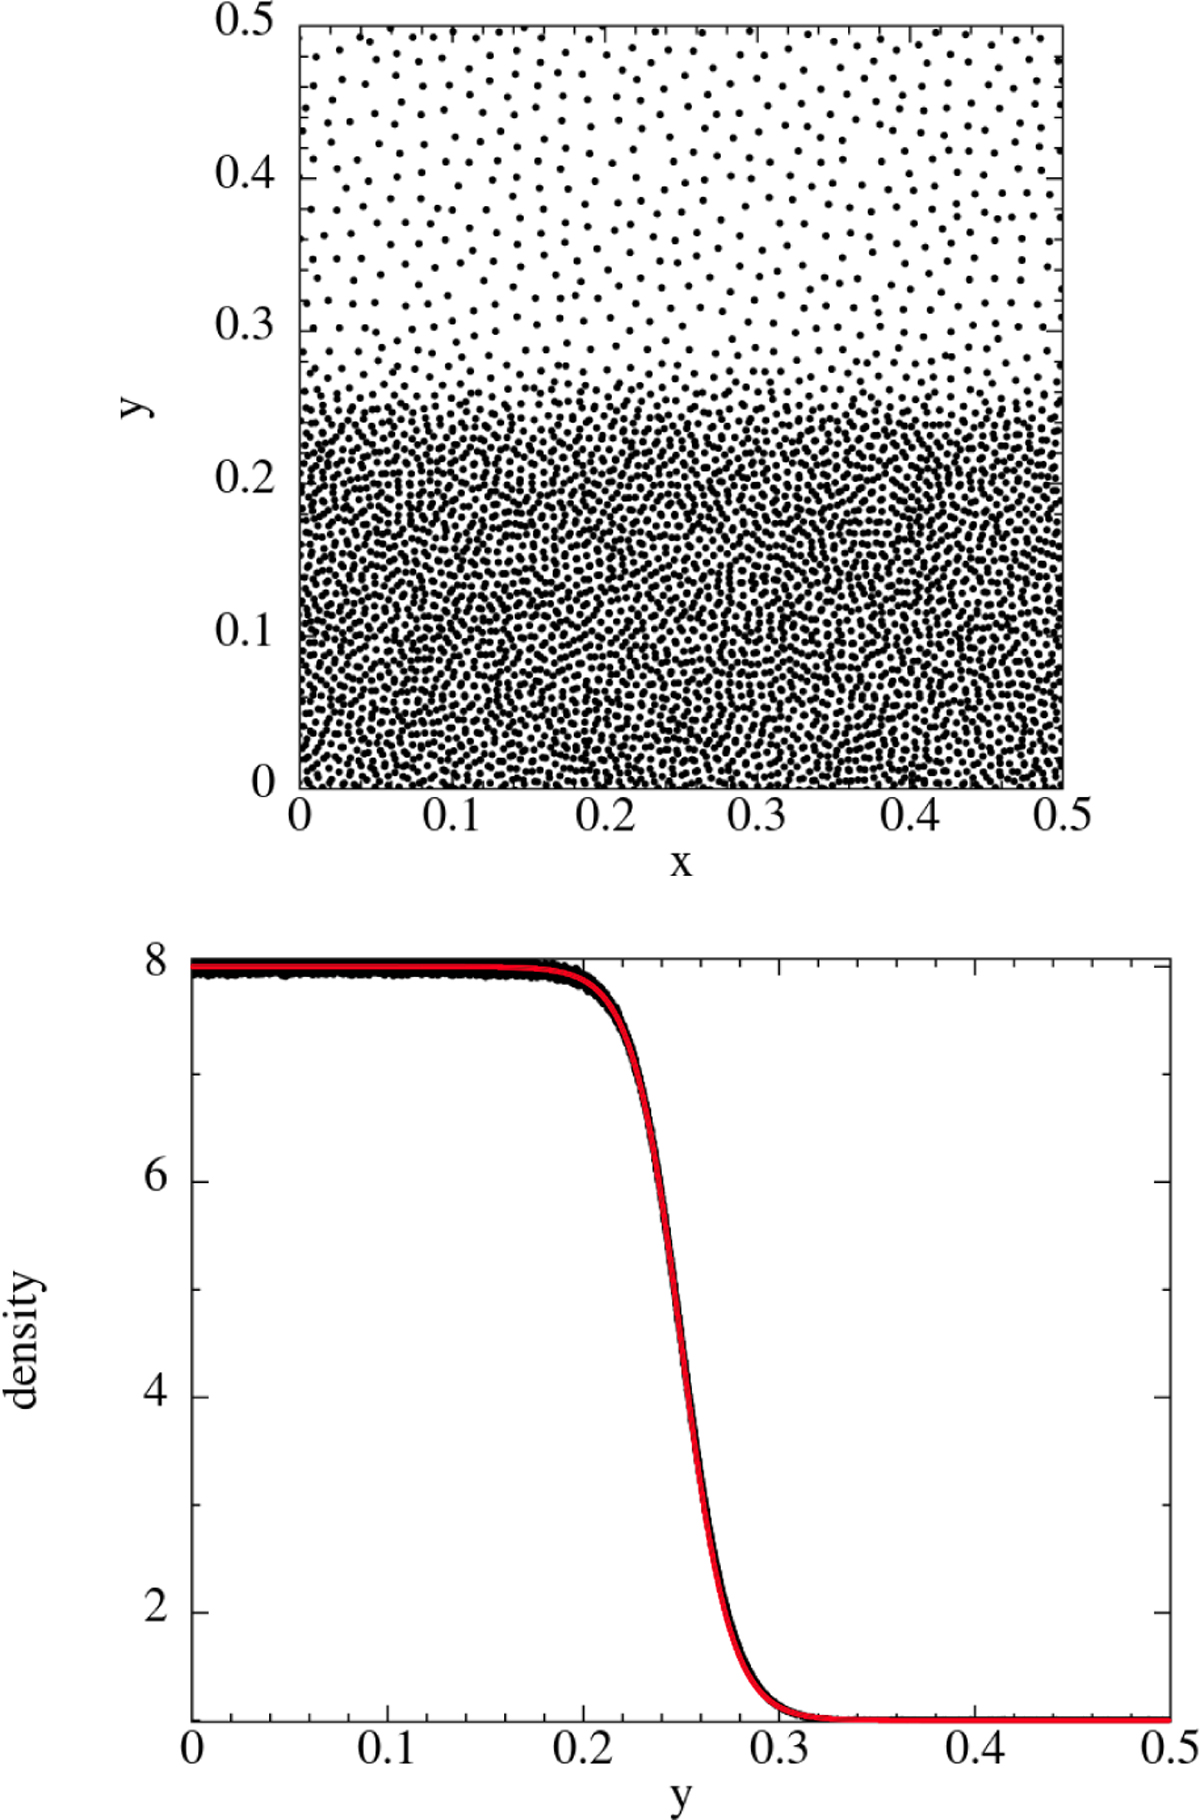
Relaxed glass IC generated by the IC generator outlined in Sect. 3.2. Here we model the IC of the Kelvin Helmholtz instability (Sect. 4.3), with a density contrast of ∆ρ = 8. Top : particle distribution within a thin slice of thickness ∆ z = 0.015. Bottom : density profile in the y direction. The red line depicts the analytical density profile and the black dots the density of the particles. The glass generated density profile is in excellent agreement with the analytical solution.
Current usage metrics show cumulative count of Article Views (full-text article views including HTML views, PDF and ePub downloads, according to the available data) and Abstracts Views on Vision4Press platform.
Data correspond to usage on the plateform after 2015. The current usage metrics is available 48-96 hours after online publication and is updated daily on week days.
Initial download of the metrics may take a while.